Estimated Value: $244,000 - $259,000
3
Beds
2
Baths
1,290
Sq Ft
$194/Sq Ft
Est. Value
About This Home
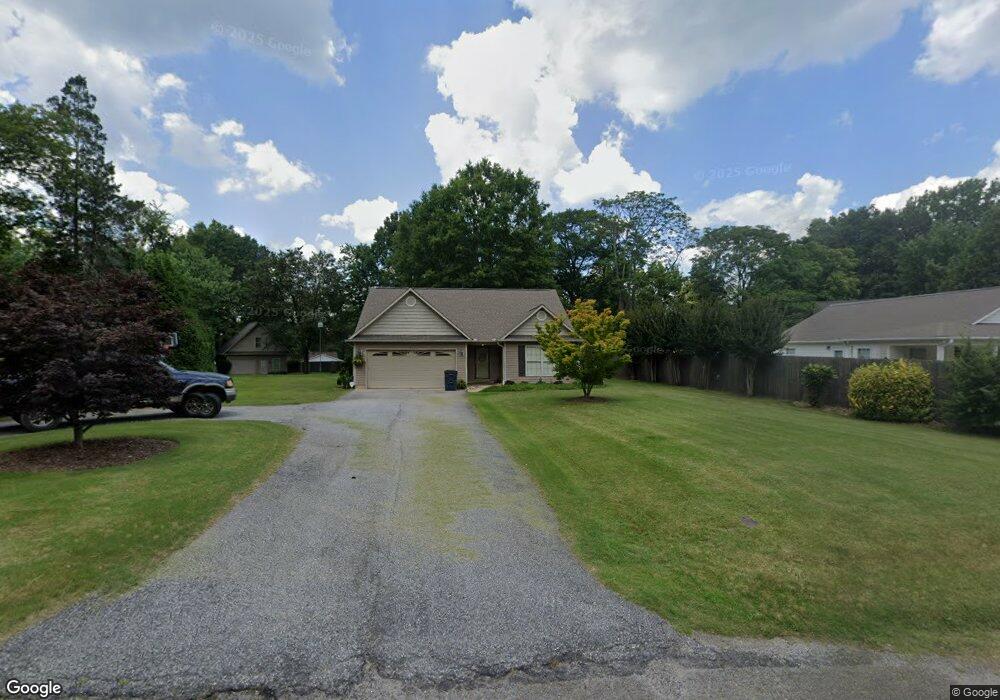
This home is located at 168 Wingo St, Inman, SC 29349 and is currently estimated at $249,670, approximately $193 per square foot. 168 Wingo St is a home located in Spartanburg County with nearby schools including Inman Elementary School, T.E. Mabry Middle School, and Chapman High School.
Ownership History
Date
Name
Owned For
Owner Type
Purchase Details
Closed on
Oct 11, 2024
Sold by
Settle Rodney Kyle
Bought by
Settle Julie K
Current Estimated Value
Purchase Details
Closed on
Feb 2, 2022
Sold by
Randall Settle James
Bought by
Settle Julie K
Purchase Details
Closed on
Jun 3, 2011
Sold by
Shehan Frankie B
Bought by
Settle James Randall and Settle Rodney Kyle
Purchase Details
Closed on
Feb 18, 2011
Sold by
Humphries Dustin C
Bought by
Shehan Frankie B
Purchase Details
Closed on
Nov 20, 2009
Sold by
Morris Chad E and Morris Charles E
Bought by
Humphries Dustin C
Purchase Details
Closed on
Feb 1, 2005
Sold by
Rogers Laura H and Hammett Laura O
Bought by
Morris Chad E and Morris Charles E
Purchase Details
Closed on
Jan 2, 2002
Sold by
Daystar Builders Inc
Bought by
Gilbert Clarence R
Create a Home Valuation Report for This Property
The Home Valuation Report is an in-depth analysis detailing your home's value as well as a comparison with similar homes in the area
Home Values in the Area
Average Home Value in this Area
Purchase History
| Date | Buyer | Sale Price | Title Company |
|---|---|---|---|
| Settle Julie K | -- | None Listed On Document | |
| Settle Julie K | -- | None Listed On Document | |
| Settle Julie K | -- | None Listed On Document | |
| Settle James Randall | -- | -- | |
| Shehan Frankie B | $143,000 | -- | |
| Humphries Dustin C | $10,000 | -- | |
| Humphries Barry E | $7,500 | -- | |
| Morris Chad E | $17,500 | -- | |
| Gilbert Clarence R | $88,900 | -- |
Source: Public Records
Mortgage History
| Date | Status | Borrower | Loan Amount |
|---|---|---|---|
| Previous Owner | Humphries Dustin C | $75,000 |
Source: Public Records
Tax History Compared to Growth
Tax History
| Year | Tax Paid | Tax Assessment Tax Assessment Total Assessment is a certain percentage of the fair market value that is determined by local assessors to be the total taxable value of land and additions on the property. | Land | Improvement |
|---|---|---|---|---|
| 2024 | $1,494 | $7,889 | $588 | $7,301 |
| 2023 | $1,494 | $7,889 | $588 | $7,301 |
| 2022 | $1,229 | $6,860 | $400 | $6,460 |
| 2021 | $972 | $5,875 | $343 | $5,532 |
| 2020 | $948 | $5,875 | $343 | $5,532 |
| 2019 | $960 | $5,875 | $343 | $5,532 |
| 2018 | $948 | $5,875 | $343 | $5,532 |
| 2017 | $751 | $5,108 | $400 | $4,708 |
| 2016 | $728 | $5,108 | $400 | $4,708 |
| 2015 | $723 | $5,108 | $400 | $4,708 |
| 2014 | $698 | $5,108 | $400 | $4,708 |
Source: Public Records
Map
Nearby Homes