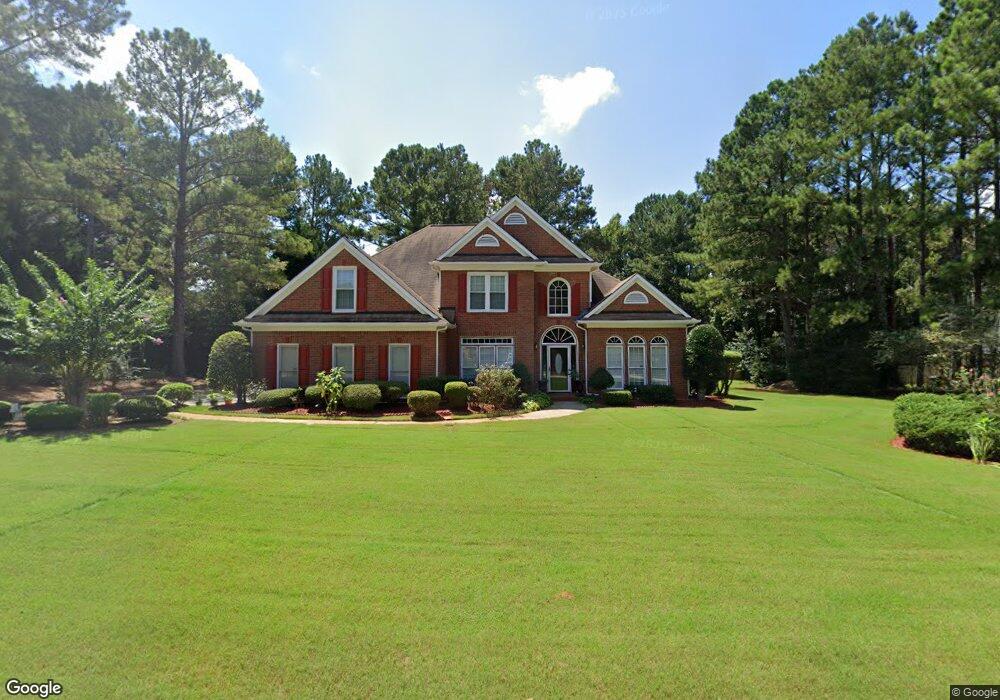
1680 Brentwood Crossing SE Unit 2 Conyers, GA 30013
Estimated Value: $344,124 - $429,000
4
Beds
3
Baths
3,080
Sq Ft
$122/Sq Ft
Est. Value
About This Home
This home is located at 1680 Brentwood Crossing SE Unit 2, Conyers, GA 30013 and is currently estimated at $375,531, approximately $121 per square foot. 1680 Brentwood Crossing SE Unit 2 is a home located in Rockdale County with nearby schools including Flat Shoals Elementary School, Memorial Middle School, and Salem High School.
Ownership History
Date
Name
Owned For
Owner Type
Purchase Details
Closed on
Jul 18, 2025
Sold by
Murphy Dotilda
Bought by
Murphy Dotilda and Murphy Devon George
Current Estimated Value
Purchase Details
Closed on
Jun 16, 2009
Sold by
Murphy Dotilda
Bought by
Murphy Dotilda and Murphy Leroy G
Purchase Details
Closed on
Nov 30, 2005
Sold by
Durham Jill
Bought by
Murphy Dotilda
Purchase Details
Closed on
Nov 25, 2003
Sold by
Cendant Mobility Finl Corp
Bought by
Durham Jill
Home Financials for this Owner
Home Financials are based on the most recent Mortgage that was taken out on this home.
Original Mortgage
$149,600
Interest Rate
5.98%
Mortgage Type
Credit Line Revolving
Purchase Details
Closed on
Jun 7, 1995
Sold by
John Wieland Ho Mes Inc
Bought by
Fleegel Joseph E Virginia
Create a Home Valuation Report for This Property
The Home Valuation Report is an in-depth analysis detailing your home's value as well as a comparison with similar homes in the area
Home Values in the Area
Average Home Value in this Area
Purchase History
| Date | Buyer | Sale Price | Title Company |
|---|---|---|---|
| Murphy Dotilda | -- | -- | |
| Murphy Dotilda | -- | -- | |
| Murphy Dotilda | $209,000 | -- | |
| Durham Jill | $187,000 | -- | |
| Cendant Mobility Finl Corp | $204,000 | -- | |
| Fleegel Joseph E Virginia | $178,000 | -- |
Source: Public Records
Mortgage History
| Date | Status | Borrower | Loan Amount |
|---|---|---|---|
| Previous Owner | Cendant Mobility Finl Corp | $149,600 | |
| Previous Owner | Cendant Mobility Finl Corp | $37,400 | |
| Closed | Fleegel Joseph E Virginia | $0 |
Source: Public Records
Tax History Compared to Growth
Tax History
| Year | Tax Paid | Tax Assessment Tax Assessment Total Assessment is a certain percentage of the fair market value that is determined by local assessors to be the total taxable value of land and additions on the property. | Land | Improvement |
|---|---|---|---|---|
| 2024 | $3,063 | $151,600 | $32,720 | $118,880 |
| 2023 | $2,768 | $146,280 | $30,360 | $115,920 |
| 2022 | $2,690 | $131,000 | $28,720 | $102,280 |
| 2021 | $2,005 | $99,360 | $20,000 | $79,360 |
| 2020 | $1,742 | $88,840 | $18,800 | $70,040 |
| 2019 | $1,374 | $75,120 | $10,040 | $65,080 |
| 2018 | $1,382 | $75,120 | $10,040 | $65,080 |
| 2017 | $1,249 | $70,360 | $10,040 | $60,320 |
| 2016 | $1,115 | $70,360 | $10,040 | $60,320 |
| 2015 | $1,032 | $67,480 | $10,040 | $57,440 |
| 2014 | $819 | $65,720 | $8,280 | $57,440 |
| 2013 | -- | $72,640 | $15,200 | $57,440 |
Source: Public Records
Map
Nearby Homes
- 3639 Cape Ln
- 2365 Brentmoore Point Unit 3
- 3803 Yorkshire Ct
- 1646 Ellington Rd SE
- 2340 Jennas Way SE
- 2303 Deerfield Chase SE Unit 5
- 2246 Exchange Place SE
- 2320 Deerfield Chase SE Unit 5
- 2112 Bradford Pear Cir SE
- 2628 Essex Ct
- 3121 Baywood Ct
- 2226 Exchange Place SE
- 2042 Avalon Blvd
- 1613 Brentwood Crossing SE Unit 3
- 2585 Golfview Terrace SE
- 3095 Brombley Dr SE
- 2405 Old Salem Rd SE Unit 1
- 2649 Fieldstone View Ln SE Unit A
- 2323 Benji Blvd SE
- 1682 Brentwood Crossing SE
- 1678 Brentwood Crossing SE
- 1683 Brentwood Crossing SE
- 2401 Twin Branches Ln
- 1681 Brentwood Crossing SE
- 2403 Twin Branches Ln Unit 4
- 1684 Brentwood Crossing SE
- 1679 Brentwood Crossing SE Unit 2
- 2503 Meadowmist Place SE
- 2399 Twin Branches Ln
- E Twin Branches Ln
- 0 Twin Branches Ln Unit 3271649
- 0 Twin Branches Ln Unit 7271963
- 0 Twin Branches Ln Unit 7053475
- 0 Twin Branches Ln Unit 3186606
- 0 Twin Branches Ln Unit 7278961
- 0 Twin Branches Ln Unit 7297373
- 0 Twin Branches Ln Unit 7620524
- 0 Twin Branches Ln Unit 8058485
- 0 Twin Branches Ln