Estimated Value: $504,000 - $1,747,720
Studio
--
Bath
1,779
Sq Ft
$633/Sq Ft
Est. Value
About This Home
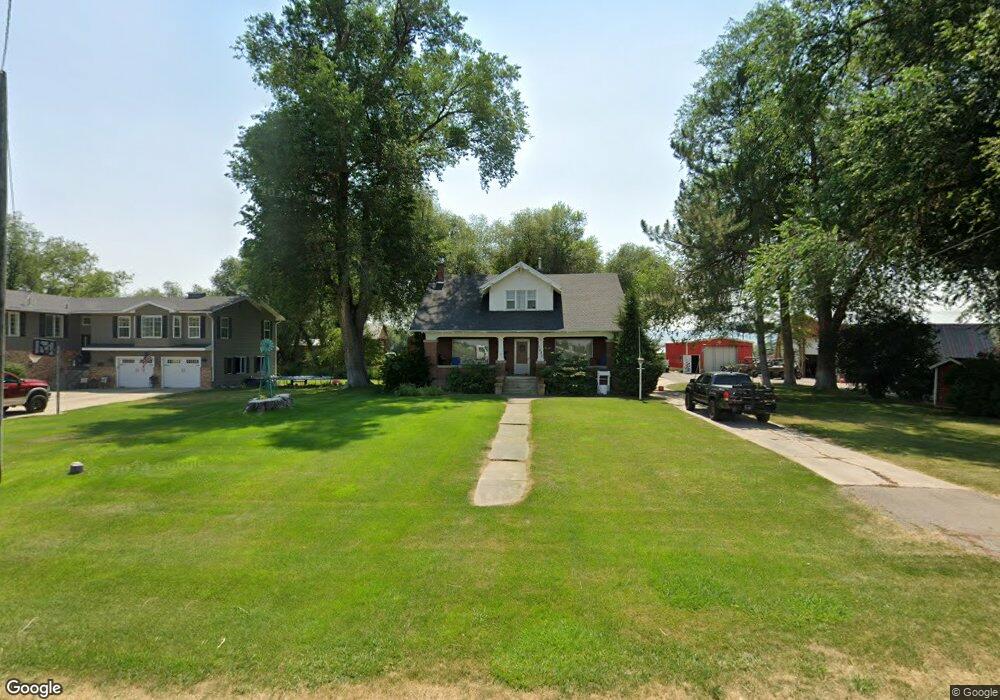
This home is located at 1680 W 3200 S, Logan, UT 84321 and is currently estimated at $1,125,860, approximately $632 per square foot. 1680 W 3200 S is a home with nearby schools including Heritage School, South Cache Middle School, and Spring Creek Middle School.
Ownership History
Date
Name
Owned For
Owner Type
Purchase Details
Closed on
Jul 13, 2022
Sold by
Zollinger Farm Holdings Llc
Bought by
Zollinger Farm Holdings Llc
Current Estimated Value
Purchase Details
Closed on
Jul 20, 2021
Sold by
Zolls Willow Creek Llc
Bought by
Zolijnger Farm Holdings Llc
Purchase Details
Closed on
Dec 27, 2012
Sold by
Zollinger Sidney M and Zollinger Jill N
Bought by
Zollinger Land Holdings Llc
Purchase Details
Closed on
Mar 20, 2006
Sold by
Zollinger Melvin S and Zollinger Elaine
Bought by
Zollinger Sidney M and Zollinger Jill N
Purchase Details
Closed on
Jun 15, 2005
Sold by
Zollinger Melvin S and Zollinger Elaine
Bought by
Zollinger Conley J and Zollinger Lareen
Create a Home Valuation Report for This Property
The Home Valuation Report is an in-depth analysis detailing your home's value as well as a comparison with similar homes in the area
Purchase History
| Date | Buyer | Sale Price | Title Company |
|---|---|---|---|
| Zollinger Farm Holdings Llc | -- | Northern Title Agency | |
| Zollinger Farm Holdings Llc | -- | Northern Title Agency | |
| Zolijnger Farm Holdings Llc | -- | None Available | |
| Zollinger Land Holdings Llc | -- | None Available | |
| Zollinger Sidney M | -- | Cache Title Company Inc | |
| Zollinger Conley J | -- | Accommodation |
Source: Public Records
Tax History
| Year | Tax Paid | Tax Assessment Tax Assessment Total Assessment is a certain percentage of the fair market value that is determined by local assessors to be the total taxable value of land and additions on the property. | Land | Improvement |
|---|---|---|---|---|
| 2025 | $4,658 | $750,480 | $0 | $0 |
| 2024 | $5,138 | $765,730 | $0 | $0 |
| 2023 | $5,173 | $721,660 | $0 | $0 |
| 2022 | $4,863 | $648,810 | $0 | $0 |
| 2021 | $5,263 | $2,356,136 | $1,836,370 | $519,766 |
| 2020 | $5,334 | $2,313,498 | $1,836,370 | $477,128 |
| 2019 | $5,643 | $2,313,498 | $1,836,370 | $477,128 |
| 2018 | $5,420 | $2,196,060 | $1,734,160 | $461,900 |
| 2017 | $5,558 | $522,740 | $0 | $0 |
| 2016 | $5,639 | $522,410 | $0 | $0 |
| 2015 | $5,628 | $522,710 | $0 | $0 |
| 2014 | $4,494 | $430,260 | $0 | $0 |
| 2013 | -- | $432,450 | $0 | $0 |
Source: Public Records
Map
Nearby Homes
- 3328 S 1525 W
- 3365 S 1460 W
- 3023 S 277 W Unit 701
- 2997 S 277 W Unit 703
- 2304 S 1050 W Unit 102
- 3314 S 1380 W
- 1361 W 3410 S
- 1336 N 1250 St E Unit 44
- 1325 N 1250 E Unit 39
- 1290 W 2690 S Unit 11
- 1300 W 2690 S Unit 6
- 1219 W 3440 S
- 1050 W 3200 S
- 2771 S 1150 W
- 1008 W 3410 S
- 2814 S 1100 W
- 3410 S 1010 W
- 3345 S 960 W
- 2882 S 1080 W
- 3350 S 960 W
Your Personal Tour Guide
Ask me questions while you tour the home.