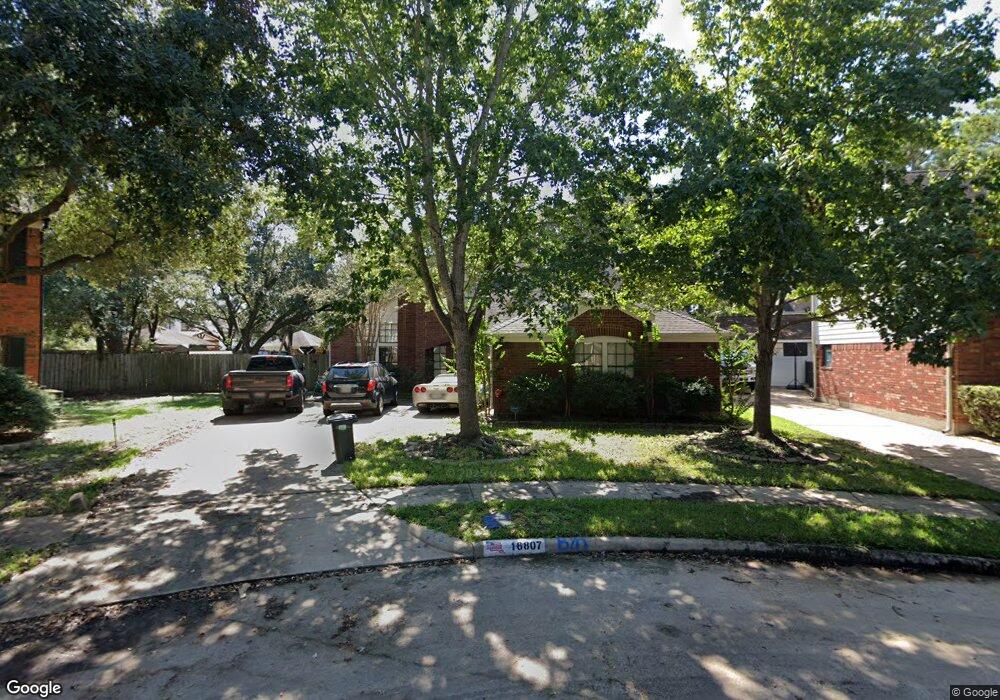
16807 Elmwood Glen Ct Houston, TX 77095
Copperfield NeighborhoodEstimated Value: $321,714 - $335,000
3
Beds
3
Baths
2,130
Sq Ft
$153/Sq Ft
Est. Value
About This Home
This home is located at 16807 Elmwood Glen Ct, Houston, TX 77095 and is currently estimated at $325,429, approximately $152 per square foot. 16807 Elmwood Glen Ct is a home located in Harris County with nearby schools including Lowery Elementary School, Aragon Middle School, and Langham Creek High School.
Ownership History
Date
Name
Owned For
Owner Type
Purchase Details
Closed on
Feb 7, 2008
Sold by
Paulk Kellee M and Paulk Kellee L
Bought by
Paulk Martin D
Current Estimated Value
Purchase Details
Closed on
Mar 29, 1996
Sold by
Schiller Karen H
Bought by
Paulk Martian D and Paulk Kellee M
Home Financials for this Owner
Home Financials are based on the most recent Mortgage that was taken out on this home.
Original Mortgage
$112,300
Outstanding Balance
$5,286
Interest Rate
7.35%
Estimated Equity
$320,143
Purchase Details
Closed on
Mar 20, 1996
Sold by
Mcpherson Kenneth Craig and Mcpherson Judy Quigley
Bought by
Schiller Karen H
Home Financials for this Owner
Home Financials are based on the most recent Mortgage that was taken out on this home.
Original Mortgage
$112,300
Outstanding Balance
$5,286
Interest Rate
7.35%
Estimated Equity
$320,143
Create a Home Valuation Report for This Property
The Home Valuation Report is an in-depth analysis detailing your home's value as well as a comparison with similar homes in the area
Home Values in the Area
Average Home Value in this Area
Purchase History
| Date | Buyer | Sale Price | Title Company |
|---|---|---|---|
| Paulk Martin D | -- | None Available | |
| Paulk Martian D | -- | Fidelity National Title | |
| Schiller Karen H | -- | Fidelity National Title |
Source: Public Records
Mortgage History
| Date | Status | Borrower | Loan Amount |
|---|---|---|---|
| Open | Paulk Martian D | $112,300 | |
| Closed | Paulk Martin D | $0 |
Source: Public Records
Tax History Compared to Growth
Tax History
| Year | Tax Paid | Tax Assessment Tax Assessment Total Assessment is a certain percentage of the fair market value that is determined by local assessors to be the total taxable value of land and additions on the property. | Land | Improvement |
|---|---|---|---|---|
| 2025 | $4,523 | $297,904 | $69,880 | $228,024 |
| 2024 | $4,523 | $297,904 | $69,880 | $228,024 |
| 2023 | $4,523 | $316,129 | $69,880 | $246,249 |
| 2022 | $5,858 | $281,882 | $49,790 | $232,092 |
| 2021 | $5,628 | $221,851 | $49,790 | $172,061 |
| 2020 | $5,410 | $215,566 | $41,491 | $174,075 |
| 2019 | $5,079 | $187,900 | $41,491 | $146,409 |
| 2018 | $1,806 | $188,052 | $41,491 | $146,561 |
| 2017 | $5,103 | $188,052 | $41,491 | $146,561 |
| 2016 | $5,103 | $188,052 | $41,491 | $146,561 |
| 2015 | $3,531 | $183,188 | $41,491 | $141,697 |
| 2014 | $3,531 | $159,772 | $36,250 | $123,522 |
Source: Public Records
Map
Nearby Homes
- 16911 Shady Square Ct
- 7607 Plumtree Forest Cir
- 17010 Poplar Hill St
- 7539 Wildwood Brook Ct
- 16734 Pebbleglen Dr
- 7311 Barton Oaks Dr
- 7306 Bubbling Brooks Ln
- 7519 Sunlight Ln
- 7254 Sonnet Glen Ln
- 16502 Rainbow Lake Rd
- 17222 Crown Meadow Ct
- 16902 Terrace Park Dr
- 7719 Woodlett Ct
- 17206 Haley Falls Ln
- 17214 Palm Falls Ct
- 17230 Valhallah Way
- 7307 Sunlight Ln
- 7614 Mccormick Mill Ct
- 7622 Mccormick Mill Ct
- 17326 Masonridge Dr
- 16803 Elmwood Glen Ct
- 16915 Shady Square Ct
- 16811 Elmwood Glen Ct
- 7523 Dogwood Falls Rd
- 7519 Dogwood Falls Rd
- 7527 Dogwood Falls Rd
- 16815 Elmwood Glen Ct
- 7515 Dogwood Falls Rd
- 16802 Elmwood Glen Ct
- 7531 Dogwood Falls Rd
- 16806 Elmwood Glen Ct
- 16907 Shady Square Ct
- 7511 Dogwood Falls Rd
- 16903 Elmwood Glen Ct
- 16810 Elmwood Glen Ct
- 16923 Shady Square Ct
- 7535 Dogwood Falls Rd
- 16814 Elmwood Glen Ct
- 7507 Dogwood Falls Rd
- 16907 Elmwood Glen Ct