Estimated Value: $585,000 - $754,000
2
Beds
2
Baths
1,390
Sq Ft
$463/Sq Ft
Est. Value
About This Home
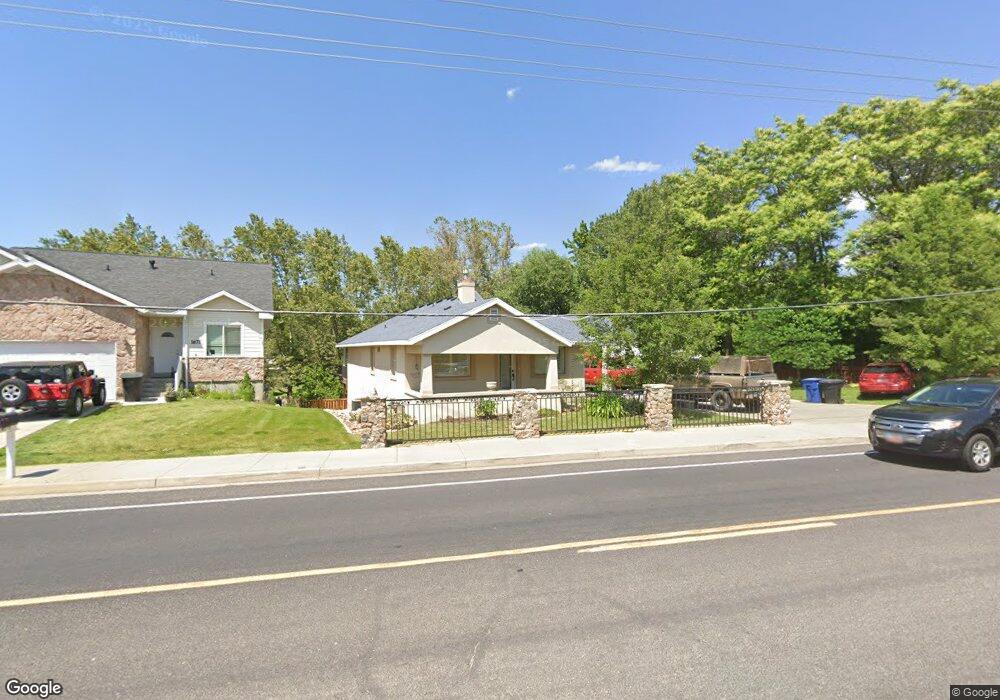
This home is located at 1681 Creek Rd Unit 2, Sandy, UT 84093 and is currently estimated at $643,079, approximately $462 per square foot. 1681 Creek Rd Unit 2 is a home located in Salt Lake County with nearby schools including Oakdale School, Albion Middle School, and Brighton High School.
Ownership History
Date
Name
Owned For
Owner Type
Purchase Details
Closed on
Apr 22, 2011
Sold by
Leary Kent
Bought by
Leary Kent
Current Estimated Value
Home Financials for this Owner
Home Financials are based on the most recent Mortgage that was taken out on this home.
Original Mortgage
$118,900
Outstanding Balance
$81,723
Interest Rate
4.72%
Mortgage Type
New Conventional
Estimated Equity
$561,356
Purchase Details
Closed on
Apr 4, 2002
Sold by
Curtis Arlene J and Brockbank Arlene J
Bought by
Curtis Arlene J
Home Financials for this Owner
Home Financials are based on the most recent Mortgage that was taken out on this home.
Original Mortgage
$200,000
Outstanding Balance
$82,732
Interest Rate
6.78%
Estimated Equity
$560,348
Purchase Details
Closed on
Apr 3, 2001
Sold by
Brockbank Arlene J
Bought by
Leary Kent
Home Financials for this Owner
Home Financials are based on the most recent Mortgage that was taken out on this home.
Original Mortgage
$144,000
Interest Rate
7.19%
Create a Home Valuation Report for This Property
The Home Valuation Report is an in-depth analysis detailing your home's value as well as a comparison with similar homes in the area
Home Values in the Area
Average Home Value in this Area
Purchase History
| Date | Buyer | Sale Price | Title Company |
|---|---|---|---|
| Leary Kent | -- | Backman Title Services | |
| Curtis Arlene J | -- | Preferred Title & Escrow Ins | |
| Leary Kent | -- | Preferred Title & Escrow Ins |
Source: Public Records
Mortgage History
| Date | Status | Borrower | Loan Amount |
|---|---|---|---|
| Open | Leary Kent | $118,900 | |
| Open | Curtis Arlene J | $200,000 | |
| Closed | Leary Kent | $144,000 |
Source: Public Records
Tax History
| Year | Tax Paid | Tax Assessment Tax Assessment Total Assessment is a certain percentage of the fair market value that is determined by local assessors to be the total taxable value of land and additions on the property. | Land | Improvement |
|---|---|---|---|---|
| 2025 | $2,638 | $537,400 | $311,500 | $225,900 |
| 2024 | $2,638 | $504,200 | $287,500 | $216,700 |
| 2023 | $2,640 | $492,100 | $276,400 | $215,700 |
| 2022 | $2,748 | $497,500 | $271,000 | $226,500 |
| 2021 | $2,503 | $387,400 | $200,800 | $186,600 |
| 2020 | $2,336 | $341,100 | $200,800 | $140,300 |
| 2019 | $2,440 | $347,000 | $197,400 | $149,600 |
| 2016 | $2,225 | $306,800 | $191,600 | $115,200 |
Source: Public Records
Map
Nearby Homes
- 1627 E Mulberry Way
- 1341 E Creek Rd
- 1780 Julho St
- 8492 S Mesa Dr
- 8109 S Cottonwood Hills Cir
- 1997 E Parkridge Dr
- 2161 E Lorita Way
- 1335 E Milne Ln
- 7755 S 1130 E
- 1695 E Ensign Place
- 8483 Terrace Dr
- 1990 E Terra Vista Way
- 2152 E Creek Rd
- 8638 Piper Ln
- 2238 Cottonwood Cove Ln
- 1354 W 7240 S
- 1924 E Viscounti Cove
- 8546 S 1330 E
- 1325 E Milne Ln
- 2110 Lonsdale Dr
- 1681 E Creek Rd
- 1681 Creek Rd
- 1667 Creek Rd Unit 1671
- 1705 Creek Rd
- 1657 E Creek Rd
- 1657 Creek Rd
- 7962 Hidden Park Ln
- 7891 Tynedale Ct
- 1658 E Creek Rd
- 7962 S Hidden Park Ln Unit 1
- 7962 S Hidden Park Ln
- 7888 S Pheasant Wood Dr
- 7899 Tynedale Ct
- 1631 Creek Rd
- 7945 S English Oaks Cove
- 1693 Creek Rd
- 7945 English Oaks Cove
- 1709 Creek Rd
- 7961 English Oaks Cove
- 7899 S Tynedale Ct
Your Personal Tour Guide
Ask me questions while you tour the home.