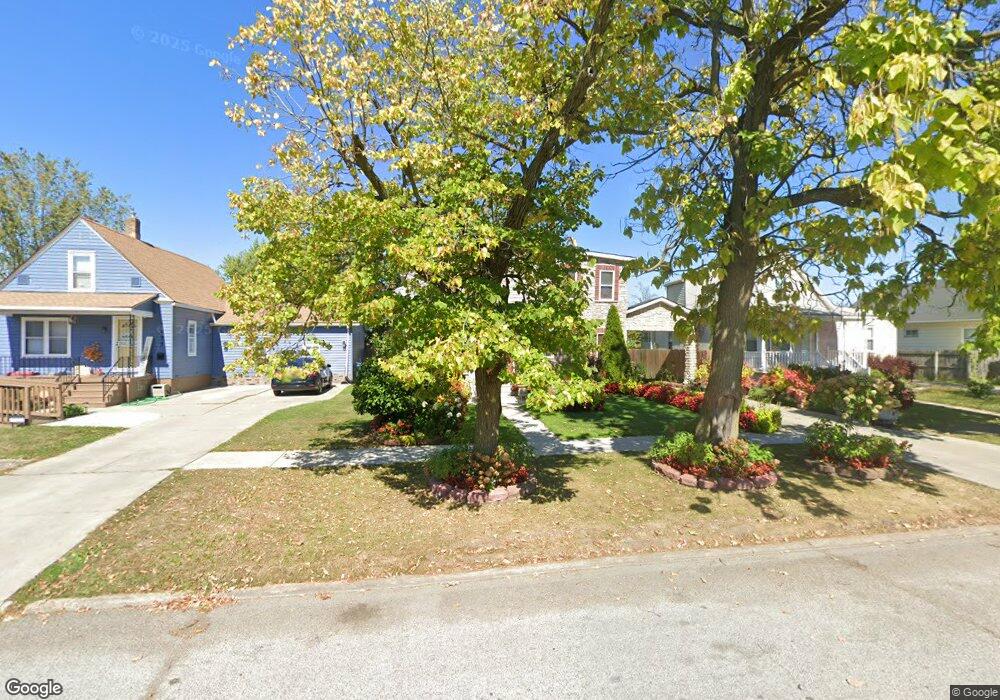
1681 E 33rd St Lorain, OH 44055
Estimated Value: $127,000 - $195,000
2
Beds
1
Bath
1,098
Sq Ft
$138/Sq Ft
Est. Value
About This Home
This home is located at 1681 E 33rd St, Lorain, OH 44055 and is currently estimated at $151,405, approximately $137 per square foot. 1681 E 33rd St is a home located in Lorain County with nearby schools including Stevan Dohanos Elementary School, Southview Middle School, and Lorain High School.
Ownership History
Date
Name
Owned For
Owner Type
Purchase Details
Closed on
Apr 13, 2009
Sold by
Us Bank National Association
Bought by
Avila Maria
Current Estimated Value
Purchase Details
Closed on
Sep 30, 2008
Sold by
Gongloff Harry L and Gongloff Heather Y
Bought by
Us Bank Na
Purchase Details
Closed on
Aug 12, 2003
Sold by
Lents Floyd L and Lents Dennis L
Bought by
Gongloff Ii Harry L
Home Financials for this Owner
Home Financials are based on the most recent Mortgage that was taken out on this home.
Original Mortgage
$47,486
Interest Rate
7.87%
Mortgage Type
Seller Take Back
Purchase Details
Closed on
Oct 22, 1997
Sold by
Rivera Jose A
Bought by
Lents Floyd L and Lents Derris L
Home Financials for this Owner
Home Financials are based on the most recent Mortgage that was taken out on this home.
Original Mortgage
$50,450
Interest Rate
7.65%
Mortgage Type
FHA
Create a Home Valuation Report for This Property
The Home Valuation Report is an in-depth analysis detailing your home's value as well as a comparison with similar homes in the area
Home Values in the Area
Average Home Value in this Area
Purchase History
| Date | Buyer | Sale Price | Title Company |
|---|---|---|---|
| Avila Maria | $9,000 | Rels Title | |
| Us Bank Na | $28,000 | None Available | |
| Gongloff Ii Harry L | $47,500 | Chicago Title Insurance Co | |
| Gongloff Ii Harry L | $47,486 | Guardian Title | |
| Lents Floyd L | $50,000 | -- |
Source: Public Records
Mortgage History
| Date | Status | Borrower | Loan Amount |
|---|---|---|---|
| Previous Owner | Gongloff Ii Harry L | $47,486 | |
| Previous Owner | Gongloff Ii Harry L | $52,000 | |
| Previous Owner | Lents Floyd L | $50,450 |
Source: Public Records
Tax History
| Year | Tax Paid | Tax Assessment Tax Assessment Total Assessment is a certain percentage of the fair market value that is determined by local assessors to be the total taxable value of land and additions on the property. | Land | Improvement |
|---|---|---|---|---|
| 2024 | $1,815 | $42,956 | $4,802 | $38,154 |
| 2023 | $2,439 | $46,155 | $2,926 | $43,229 |
| 2022 | $2,418 | $46,155 | $2,926 | $43,229 |
| 2021 | $2,418 | $46,155 | $2,926 | $43,229 |
| 2020 | $2,448 | $40,590 | $2,570 | $38,020 |
| 2019 | $2,434 | $40,590 | $2,570 | $38,020 |
| 2018 | $1,649 | $36,430 | $2,570 | $33,860 |
| 2017 | $1,113 | $17,490 | $3,430 | $14,060 |
| 2016 | $882 | $13,970 | $3,430 | $10,540 |
| 2015 | $833 | $13,970 | $3,430 | $10,540 |
| 2014 | $873 | $13,970 | $3,430 | $10,540 |
| 2013 | $825 | $13,970 | $3,430 | $10,540 |
Source: Public Records
Map
Nearby Homes
- 1685 E 36th St
- 1743 E 36th St
- 1809 E 34th St
- 1829 E 33rd St
- 1863 E 37th St
- 0 Pearl Ave Unit 5112836
- 3442 Albany Ave
- 3538 Albany Ave
- 3323 Dallas Ave
- V/L Pearl Ave
- 3521 Omaha Ave
- 4137 Dunton Rd
- 0 Canton Ave
- 1951 E 39th St
- 4095 Laurel Rd
- 4400 Dunton Rd
- 3825 Canton Ave
- 2066 E 30th St
- 3011 Caroline Ave
- V/L Clinton Ave
Your Personal Tour Guide
Ask me questions while you tour the home.