16810 Agate Point Rd NE Bainbridge Island, WA 98110
Estimated Value: $1,190,000 - $1,462,188
3
Beds
2
Baths
1,898
Sq Ft
$707/Sq Ft
Est. Value
About This Home
This home is located at 16810 Agate Point Rd NE, Bainbridge Island, WA 98110 and is currently estimated at $1,341,797, approximately $706 per square foot. 16810 Agate Point Rd NE is a home located in Kitsap County with nearby schools including Bainbridge High School, The Island School, and West Sound Academy.
Ownership History
Date
Name
Owned For
Owner Type
Purchase Details
Closed on
Dec 1, 1995
Sold by
Michael Joseph A and Michael Barbara C
Bought by
Babbe Donald A and Babbe Barbara M
Current Estimated Value
Purchase Details
Closed on
Nov 22, 1995
Sold by
Peterson Craig M
Bought by
Michael Joseph A and Michael Barbara C
Home Financials for this Owner
Home Financials are based on the most recent Mortgage that was taken out on this home.
Original Mortgage
$203,150
Interest Rate
7.97%
Purchase Details
Closed on
Sep 25, 1995
Sold by
Smiley Janet S
Bought by
Michael Joseph A and Michael Barbara C
Home Financials for this Owner
Home Financials are based on the most recent Mortgage that was taken out on this home.
Original Mortgage
$203,150
Interest Rate
7.97%
Create a Home Valuation Report for This Property
The Home Valuation Report is an in-depth analysis detailing your home's value as well as a comparison with similar homes in the area
Home Values in the Area
Average Home Value in this Area
Purchase History
| Date | Buyer | Sale Price | Title Company |
|---|---|---|---|
| Babbe Donald A | -- | Stewart Title Co | |
| Michael Joseph A | $3,000 | Stewart Title Co | |
| Michael Joseph A | $410,000 | Stewart Title Co |
Source: Public Records
Mortgage History
| Date | Status | Borrower | Loan Amount |
|---|---|---|---|
| Previous Owner | Michael Joseph A | $203,150 |
Source: Public Records
Tax History Compared to Growth
Tax History
| Year | Tax Paid | Tax Assessment Tax Assessment Total Assessment is a certain percentage of the fair market value that is determined by local assessors to be the total taxable value of land and additions on the property. | Land | Improvement |
|---|---|---|---|---|
| 2026 | $9,567 | $1,183,380 | $664,810 | $518,570 |
| 2025 | $9,567 | $1,183,380 | $664,810 | $518,570 |
| 2024 | $9,143 | $1,183,380 | $664,810 | $518,570 |
| 2023 | $9,542 | $1,183,380 | $664,810 | $518,570 |
| 2022 | $8,883 | $938,280 | $519,620 | $418,660 |
| 2021 | $8,658 | $872,050 | $480,740 | $391,310 |
| 2020 | $8,776 | $872,050 | $480,740 | $391,310 |
| 2019 | $7,748 | $783,690 | $429,300 | $354,390 |
| 2018 | $7,938 | $716,630 | $452,550 | $264,080 |
| 2017 | $7,456 | $716,630 | $452,550 | $264,080 |
| 2016 | $6,669 | $607,700 | $345,010 | $262,690 |
| 2015 | $5,985 | $555,530 | $312,730 | $242,800 |
| 2014 | -- | $496,670 | $276,410 | $220,260 |
| 2013 | -- | $496,670 | $276,410 | $220,260 |
Source: Public Records
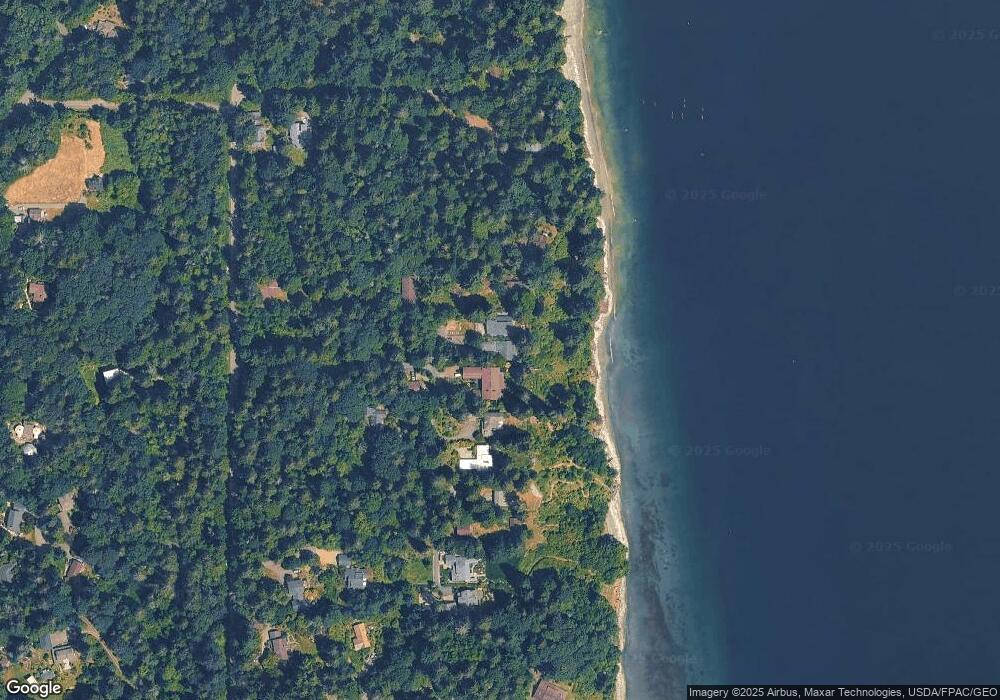
Map
Nearby Homes
- 16790 Agate Point Rd NE
- 8552 NE Gordon Dr
- 8180 NE West Port Madison Rd
- 8484 NE County Park Rd
- 15630 Agatewood Rd NE
- 7800 NE West Port Madison Rd
- 17274 Angeline Ave NE
- 6341 NE Balzow Rd
- 17691 Division Ave NE
- 17880 Purves Ave NE
- 17655 Division Ave NE
- 18689 1st Ave NE
- 18610 5th Ave NE
- 19313 Harris Ave NE
- 17711 Division Ave NE
- 18872 Augusta Ave NE
- 18971 Soundview Blvd NE
- 6712 NE Geneva St
- 9844 NE Lafayette Ave
- 5450 NE Laura Loop
- 16820 Agate Point Rd NE
- 7781 NE North St
- 16786 Agate Point Rd NE
- 7782 NE North St
- 7789 NE North St
- 16780 Agate Point Rd NE
- 16770 Agate Point Rd NE
- 16766 Agate Point Rd NE
- 16900 Agate Point Rd NE
- 16760 Agate Point Rd NE
- 7793 NE North St
- 16750 Agate Point Rd NE
- 16744 Agate Point Rd NE
- 16684 Agate Point Rd NE
- 7784 NE North St
- 7641 NE North St
- 7752 NE North St
- 7627 NE North St
- 16680 Agate Point Rd NE
- 16630 Agate Point Rd NE