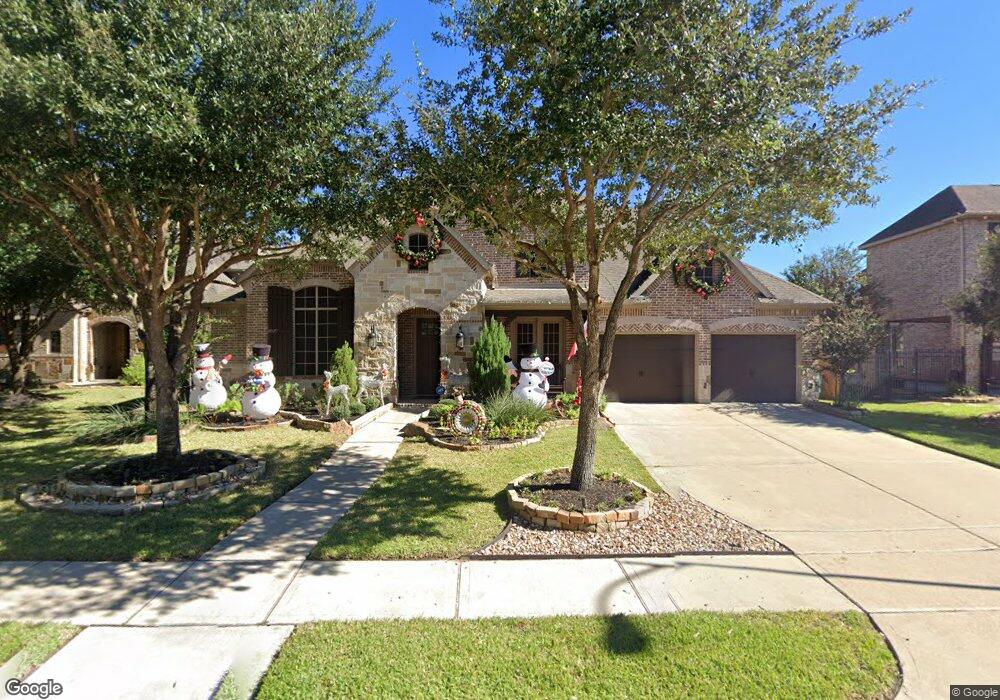
16810 N Azure Mist Ct Cypress, TX 77433
Fairfield Village NeighborhoodEstimated Value: $715,000 - $812,000
4
Beds
5
Baths
3,919
Sq Ft
$193/Sq Ft
Est. Value
About This Home
This home is located at 16810 N Azure Mist Ct, Cypress, TX 77433 and is currently estimated at $756,511, approximately $193 per square foot. 16810 N Azure Mist Ct is a home located in Harris County with nearby schools including Swenke Elementary School, Salyards Middle, and Bridgeland High School.
Ownership History
Date
Name
Owned For
Owner Type
Purchase Details
Closed on
Mar 16, 2023
Sold by
Miller Robert Andrew
Bought by
Marcantel Catherin
Current Estimated Value
Purchase Details
Closed on
May 12, 2014
Sold by
Moss Paul John and Moss Ligia A
Bought by
Miller Robert A and Marcantel Catherine A
Home Financials for this Owner
Home Financials are based on the most recent Mortgage that was taken out on this home.
Original Mortgage
$397,000
Interest Rate
4.46%
Mortgage Type
VA
Purchase Details
Closed on
Aug 3, 2012
Sold by
Highland Homes Houston Ltd
Bought by
Moss Paul John and Moss Ligia A
Home Financials for this Owner
Home Financials are based on the most recent Mortgage that was taken out on this home.
Original Mortgage
$317,700
Interest Rate
4.25%
Mortgage Type
Adjustable Rate Mortgage/ARM
Purchase Details
Closed on
Jan 11, 2012
Sold by
Exxon Land Development Inc
Bought by
Highland Homes Houston Ltd
Create a Home Valuation Report for This Property
The Home Valuation Report is an in-depth analysis detailing your home's value as well as a comparison with similar homes in the area
Home Values in the Area
Average Home Value in this Area
Purchase History
| Date | Buyer | Sale Price | Title Company |
|---|---|---|---|
| Marcantel Catherin | -- | None Listed On Document | |
| Miller Robert A | -- | Stewart Title | |
| Moss Paul John | -- | Old Republic National Title | |
| Moss Paul John | -- | None Available | |
| Highland Homes Houston Ltd | -- | Ortc |
Source: Public Records
Mortgage History
| Date | Status | Borrower | Loan Amount |
|---|---|---|---|
| Previous Owner | Miller Robert A | $397,000 | |
| Previous Owner | Moss Paul John | $317,700 |
Source: Public Records
Tax History Compared to Growth
Tax History
| Year | Tax Paid | Tax Assessment Tax Assessment Total Assessment is a certain percentage of the fair market value that is determined by local assessors to be the total taxable value of land and additions on the property. | Land | Improvement |
|---|---|---|---|---|
| 2025 | $11,812 | $675,000 | $99,195 | $575,805 |
| 2024 | $11,812 | $681,952 | $99,195 | $582,757 |
| 2023 | $11,812 | $746,243 | $99,195 | $647,048 |
| 2022 | $14,747 | $666,353 | $76,304 | $590,049 |
| 2021 | $14,183 | $543,201 | $75,909 | $467,292 |
| 2020 | $13,425 | $489,203 | $63,424 | $425,779 |
| 2019 | $13,739 | $481,103 | $63,424 | $417,679 |
| 2018 | $0 | $482,486 | $63,424 | $419,062 |
| 2017 | $27,152 | $448,600 | $63,424 | $385,176 |
| 2016 | $12,468 | $412,000 | $63,424 | $348,576 |
| 2015 | $10,769 | $445,757 | $63,424 | $382,333 |
| 2014 | $10,769 | $417,105 | $63,424 | $353,681 |
Source: Public Records
Map
Nearby Homes
- 16727 Thomas Ridge Ln
- 16618 S Swirling Cloud Ct
- 16909 W Caramel Apple Trail
- 21602 W Gold Buttercup Ct
- 21511 Amber Grain Ln
- 21802 W Citrus Rose Ct
- 15127 Turquoise Mist Dr
- 21806 W Firemist Ct
- 21103 Parish Timbers Ct
- 22015 Bronze Leaf Dr
- 20906 Ochre Willow Trail
- 16703 Radiant Lilac Trail
- 16714 Radiant Lilac Trail
- 16603 Radiant Lilac Trail
- 16610 Empire Gold Dr
- 15334 Sienna Oak Dr
- 20815 Golden Sycamore Trail
- 22118 Silver Blueberry Trail
- 20714 N Blue Hyacinth Dr
- 22011 Gray Pearl Ct
- 16814 N Azure Mist Ct
- 16806 N Azure Mist Ct
- 21207 Catherine Anne Ct
- 16818 N Azure Mist Ct
- 16802 N Azure Mist Ct
- 16807 N Azure Mist Ct
- 16811 N Azure Mist Ct
- 21211 Catherine Anne Ct
- 16807 Thomas Ridge Ln
- 16803 N Azure Mist Ct
- 16803 Thomas Ridge Ln
- 16815 N Azure Mist Ct
- 16811 Thomas Ridge Ln
- 16718 S Azure Mist Ct
- 21210 Catherine Anne Ct
- 16731 Thomas Ridge Ln
- 21206 Catherine Anne Ct
- 16719 S Azure Mist Ct
- 21202 Catherine Anne Ct
- 16802 Thomas Ridge Ln