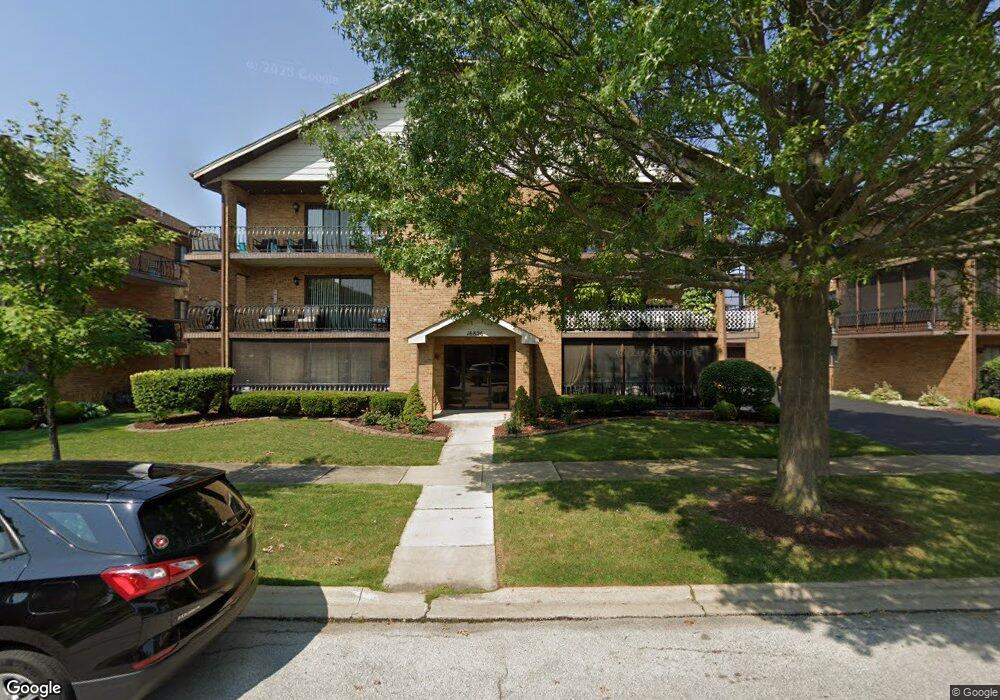
16826 81st Ave Unit 16826 Tinley Park, IL 60477
East Fernway Park NeighborhoodEstimated Value: $192,067 - $252,000
2
Beds
2
Baths
1,400
Sq Ft
$157/Sq Ft
Est. Value
About This Home
This home is located at 16826 81st Ave Unit 16826, Tinley Park, IL 60477 and is currently estimated at $220,017, approximately $157 per square foot. 16826 81st Ave Unit 16826 is a home located in Cook County with nearby schools including John A Bannes Elementary School, Virgil I Grissom Middle School, and Victor J Andrew High School.
Ownership History
Date
Name
Owned For
Owner Type
Purchase Details
Closed on
Sep 30, 2004
Sold by
Schultz Anthony
Bought by
Novacek Peter
Current Estimated Value
Home Financials for this Owner
Home Financials are based on the most recent Mortgage that was taken out on this home.
Original Mortgage
$127,920
Interest Rate
5.75%
Mortgage Type
Unknown
Purchase Details
Closed on
Jun 20, 1997
Sold by
Driscoll Marie Suzanne and Lieser Krista Michelle
Bought by
Schultz Anthony
Home Financials for this Owner
Home Financials are based on the most recent Mortgage that was taken out on this home.
Original Mortgage
$79,125
Interest Rate
12.49%
Purchase Details
Closed on
May 13, 1994
Sold by
Vanhorn Robert J and Vanhorn Andrea R
Bought by
Suzanne Marie Suzanne and Lieser Krista Michelle
Home Financials for this Owner
Home Financials are based on the most recent Mortgage that was taken out on this home.
Original Mortgage
$101,650
Interest Rate
8.08%
Create a Home Valuation Report for This Property
The Home Valuation Report is an in-depth analysis detailing your home's value as well as a comparison with similar homes in the area
Home Values in the Area
Average Home Value in this Area
Purchase History
| Date | Buyer | Sale Price | Title Company |
|---|---|---|---|
| Novacek Peter | $160,000 | Ctic | |
| Schultz Anthony | $105,500 | Ticor Title | |
| Suzanne Marie Suzanne | $107,000 | -- |
Source: Public Records
Mortgage History
| Date | Status | Borrower | Loan Amount |
|---|---|---|---|
| Closed | Novacek Peter | $127,920 | |
| Previous Owner | Schultz Anthony | $79,125 | |
| Previous Owner | Suzanne Marie Suzanne | $101,650 |
Source: Public Records
Tax History Compared to Growth
Tax History
| Year | Tax Paid | Tax Assessment Tax Assessment Total Assessment is a certain percentage of the fair market value that is determined by local assessors to be the total taxable value of land and additions on the property. | Land | Improvement |
|---|---|---|---|---|
| 2024 | $3,629 | $16,385 | $1,241 | $15,144 |
| 2023 | $3,120 | $16,385 | $1,241 | $15,144 |
| 2022 | $3,120 | $12,173 | $955 | $11,218 |
| 2021 | $3,051 | $12,172 | $954 | $11,218 |
| 2020 | $3,048 | $12,172 | $954 | $11,218 |
| 2019 | $2,301 | $10,525 | $859 | $9,666 |
| 2018 | $2,250 | $10,525 | $859 | $9,666 |
| 2017 | $2,209 | $10,525 | $859 | $9,666 |
| 2016 | $2,803 | $10,936 | $763 | $10,173 |
| 2015 | $2,731 | $10,936 | $763 | $10,173 |
| 2014 | $2,726 | $10,936 | $763 | $10,173 |
| 2013 | $2,770 | $11,800 | $763 | $11,037 |
Source: Public Records
Map
Nearby Homes
- 8106 168th Place Unit 3W
- 8118 168th Place
- 8136 168th Place Unit 3E
- 7938 Paxton Ave Unit 3E
- 7925 Paxton Ave Unit 1A
- 7913 Paxton Ave Unit 1W
- 16705 Paxton Ave
- 16666 Parliament Ave
- 8229 170th St Unit 8229
- 7810 166th Place
- 17116 Dooneen Ave
- 16413 Prairie Dr
- 8400 167th St
- 7914 164th Ct Unit 262
- 7727 166th St
- 16401 Tanbark Dr
- 7632 Hanover Dr
- 16610 76th Ave
- 8444 W 171st St
- 16531 76th Ave
- 16826 81st Ave Unit 16826
- 16826 81st Ave Unit 16826
- 16826 81st Ave Unit 16826
- 16826 81st Ave Unit 16826
- 16826 81st Ave Unit 16826
- 16826 81st Ave Unit 2S
- 16826 81st Ave Unit 3S
- 16826 81st Ave Unit 1S
- 16820 81st Ave Unit 16820
- 16820 81st Ave Unit 16820
- 16820 81st Ave Unit 16820
- 16820 81st Ave Unit 16820
- 16820 81st Ave Unit 16820
- 16820 81st Ave Unit 16820
- 16820 81st Ave Unit 2N
- 16820 81st Ave Unit 1N
- 16820 81st Ave Unit 1-S
- 16820 81st Ave Unit 2S
- 16820 81st Ave Unit 3N
- 16814 81st Ave Unit 3S