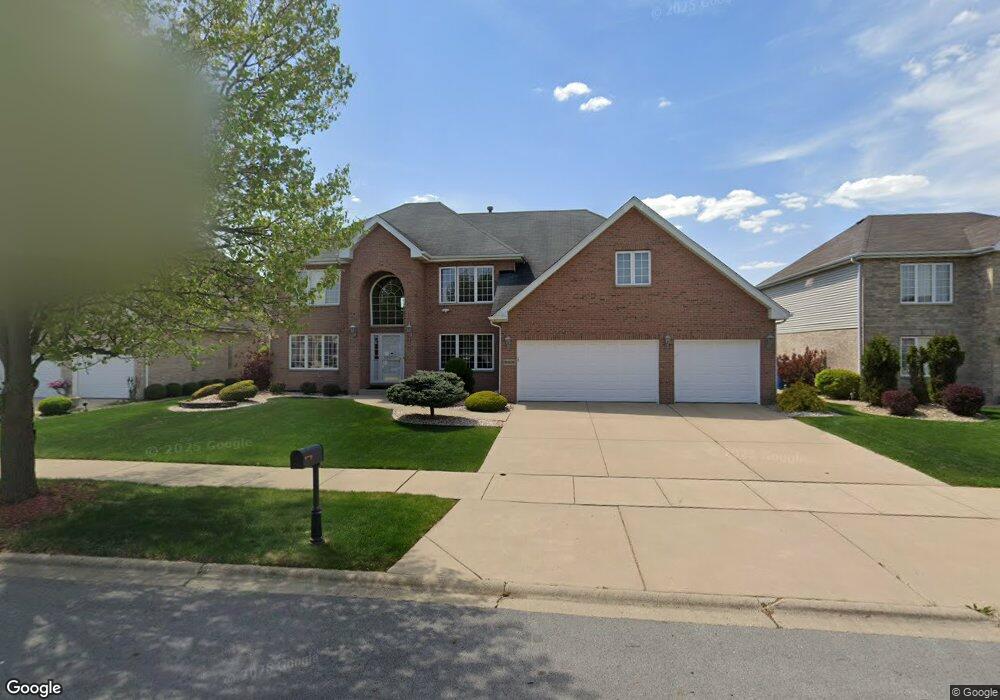
16826 Carrington Dr South Holland, IL 60473
Estimated Value: $393,000 - $474,000
4
Beds
3
Baths
3,444
Sq Ft
$125/Sq Ft
Est. Value
About This Home
This home is located at 16826 Carrington Dr, South Holland, IL 60473 and is currently estimated at $430,355, approximately $124 per square foot. 16826 Carrington Dr is a home located in Cook County with nearby schools including Greenwood Elementary School, Mckinley Elementary School, and Mckinley Jr High School.
Ownership History
Date
Name
Owned For
Owner Type
Purchase Details
Closed on
Feb 15, 2005
Sold by
Bell Virginia
Bought by
Bell Virginia and Godbold Paul
Current Estimated Value
Home Financials for this Owner
Home Financials are based on the most recent Mortgage that was taken out on this home.
Original Mortgage
$375,000
Outstanding Balance
$188,849
Interest Rate
5.61%
Mortgage Type
New Conventional
Estimated Equity
$241,506
Purchase Details
Closed on
May 21, 2002
Sold by
Premier Homes Inc
Bought by
Bell Virginia
Home Financials for this Owner
Home Financials are based on the most recent Mortgage that was taken out on this home.
Original Mortgage
$350,548
Interest Rate
7.37%
Create a Home Valuation Report for This Property
The Home Valuation Report is an in-depth analysis detailing your home's value as well as a comparison with similar homes in the area
Home Values in the Area
Average Home Value in this Area
Purchase History
| Date | Buyer | Sale Price | Title Company |
|---|---|---|---|
| Bell Virginia | -- | -- | |
| Bell Virginia | $390,000 | -- |
Source: Public Records
Mortgage History
| Date | Status | Borrower | Loan Amount |
|---|---|---|---|
| Open | Bell Virginia | $375,000 | |
| Closed | Bell Virginia | $350,548 |
Source: Public Records
Tax History Compared to Growth
Tax History
| Year | Tax Paid | Tax Assessment Tax Assessment Total Assessment is a certain percentage of the fair market value that is determined by local assessors to be the total taxable value of land and additions on the property. | Land | Improvement |
|---|---|---|---|---|
| 2024 | $15,749 | $36,000 | $6,098 | $29,902 |
| 2023 | $12,577 | $36,000 | $6,098 | $29,902 |
| 2022 | $12,577 | $23,791 | $5,267 | $18,524 |
| 2021 | $12,114 | $23,789 | $5,266 | $18,523 |
| 2020 | $11,516 | $23,789 | $5,266 | $18,523 |
| 2019 | $12,569 | $25,489 | $4,435 | $21,054 |
| 2018 | $12,019 | $25,489 | $4,435 | $21,054 |
| 2017 | $11,749 | $25,489 | $4,435 | $21,054 |
| 2016 | $11,985 | $25,672 | $4,158 | $21,514 |
| 2015 | $11,536 | $25,672 | $4,158 | $21,514 |
| 2014 | $11,279 | $25,672 | $4,158 | $21,514 |
| 2013 | $10,624 | $26,235 | $4,158 | $22,077 |
Source: Public Records
Map
Nearby Homes
- 16822 Merrill Ave
- 1970 E 170th St
- 16909 Paxton Ave
- 17048 Clyde Ave
- 16747 Paxton Ave
- 2024 E 171st Ct
- 400 Park Ave Unit 118
- 400 Park Ave Unit 411
- 400 Park Ave Unit 100
- 400 Park Ave Unit 211
- 500 Park Ave Unit 433
- 500 Park Ave Unit 238
- 500 Park Ave Unit 537
- 500 Park Ave Unit 236
- 1325 E 168th Place
- 300 Park Ave Unit 639
- 1320 E 169th Place
- 2080 Fairview Ln
- 100 Park Ave
- 200 Park Ave Unit 527
- 16834 Carrington Dr
- 16820 Carrington Dr
- 16844 Carrington Dr
- 16812 Carrington Dr
- 16827 Carrington Dr Unit 2
- 16835 Carrington Dr
- 16821 Carrington Dr Unit 2
- 16804 Carrington Dr Unit 9
- 16845 Carrington Dr
- 16813 Carrington Dr Unit 2
- 16800 Carrington Dr
- 16853 Carrington Dr Unit 22
- 16805 Carrington Dr
- 16826 Manor Dr
- 16820 Manor Dr
- 16834 Manor Dr
- 16844 Manor Dr
- 16903 Carrington Dr
- 16903 Carrington Dr
- 16760 Carrington Dr