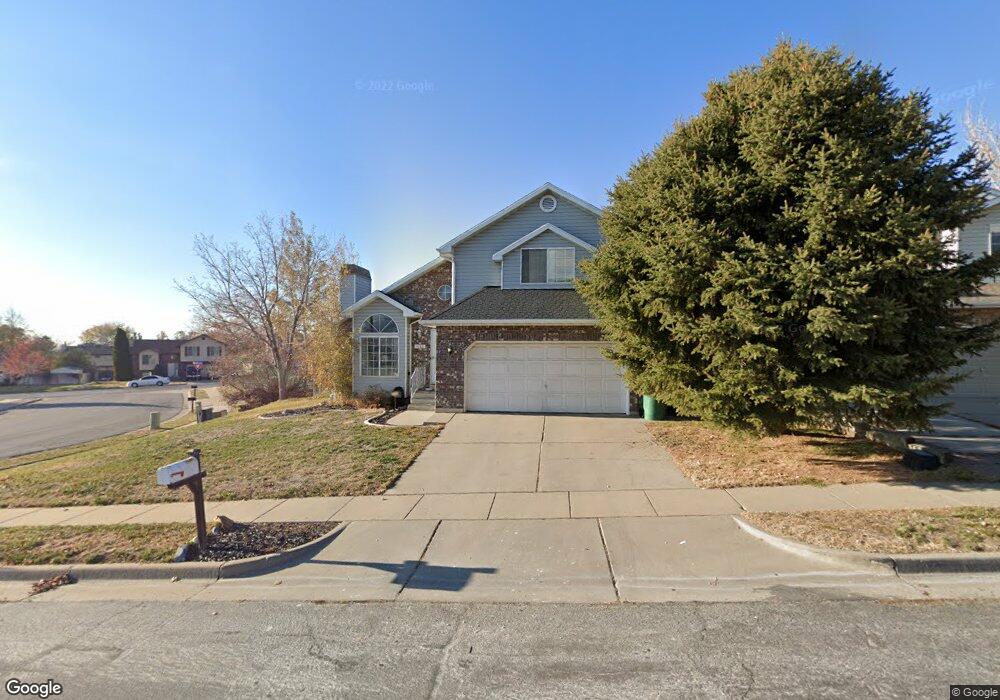
1683 E 2825 N Layton, UT 84040
Estimated Value: $429,000 - $452,000
3
Beds
2
Baths
1,929
Sq Ft
$229/Sq Ft
Est. Value
About This Home
This home is located at 1683 E 2825 N, Layton, UT 84040 and is currently estimated at $442,585, approximately $229 per square foot. 1683 E 2825 N is a home located in Davis County with nearby schools including Mountain View Elementary School, North Layton Junior High School, and Northridge High School.
Ownership History
Date
Name
Owned For
Owner Type
Purchase Details
Closed on
Jul 2, 2020
Sold by
Romer Craig A and Romer Linda
Bought by
Romer Craig A and Romer Linda A
Current Estimated Value
Purchase Details
Closed on
Nov 10, 2004
Sold by
Long Danny Carl
Bought by
Romer Craig A and Romer Linda
Purchase Details
Closed on
Aug 22, 2001
Sold by
Henley Christopher J and Henley Julie A
Bought by
Long Danny Carl
Home Financials for this Owner
Home Financials are based on the most recent Mortgage that was taken out on this home.
Original Mortgage
$128,000
Interest Rate
7.21%
Purchase Details
Closed on
Sep 24, 1996
Sold by
Williams Todd C and Williams Laurie L
Bought by
Henley Christopher J and Henley Julie A
Home Financials for this Owner
Home Financials are based on the most recent Mortgage that was taken out on this home.
Original Mortgage
$123,098
Interest Rate
7.87%
Mortgage Type
FHA
Create a Home Valuation Report for This Property
The Home Valuation Report is an in-depth analysis detailing your home's value as well as a comparison with similar homes in the area
Home Values in the Area
Average Home Value in this Area
Purchase History
| Date | Buyer | Sale Price | Title Company |
|---|---|---|---|
| Romer Craig A | -- | None Available | |
| Romer Craig A | -- | Backman Stewart Title Svcs | |
| Long Danny Carl | -- | First American Title Insuran | |
| Henley Christopher J | -- | First American Title Co |
Source: Public Records
Mortgage History
| Date | Status | Borrower | Loan Amount |
|---|---|---|---|
| Previous Owner | Long Danny Carl | $128,000 | |
| Previous Owner | Henley Christopher J | $123,098 |
Source: Public Records
Tax History
| Year | Tax Paid | Tax Assessment Tax Assessment Total Assessment is a certain percentage of the fair market value that is determined by local assessors to be the total taxable value of land and additions on the property. | Land | Improvement |
|---|---|---|---|---|
| 2025 | $325 | $214,500 | $97,625 | $116,875 |
| 2024 | $261 | $207,349 | $123,347 | $84,002 |
| 2023 | $2,101 | $198,550 | $95,747 | $102,802 |
| 2022 | $2,169 | $371,000 | $168,513 | $202,487 |
| 2021 | $2,012 | $282,000 | $139,949 | $142,051 |
| 2020 | $1,799 | $241,000 | $109,030 | $131,970 |
| 2019 | $1,754 | $232,000 | $98,309 | $133,691 |
| 2018 | $1,582 | $210,000 | $56,662 | $153,338 |
| 2016 | $1,410 | $98,395 | $29,585 | $68,810 |
| 2015 | $1,332 | $88,770 | $29,585 | $59,185 |
| 2014 | $1,249 | $85,606 | $29,585 | $56,021 |
| 2013 | -- | $87,502 | $20,087 | $67,415 |
Source: Public Records
Map
Nearby Homes
- 2826 N 1600 E
- 1731 E 2825 N
- 1785 E 2825 N
- 1911 Deere Valley Dr
- 1821 E Whitetail Way
- 1935 Deere Valley Dr
- 1447 E 2700 N
- 1827 E Whitetail Dr
- 3142 E Thorley Dr
- 3138 E Thorley Dr
- 3176 N 1450 E
- 1321 E 3125 N
- 1241 E 3075 N
- 1266 E 3125 N
- 1444 E 2400 N
- 3232 N Redtail Way
- 2340 N 2050 E
- 2273 N 1975 E
- 2189 N 1950 E
- 2353 Canyon View Dr
- 1685 E 2825 N
- 1681 E 2800 N
- 2814 E 1650 N
- 1688 E 2825 N
- 1715 E 2825 N
- 2798 N 1650 E
- 1692 E 2825 N
- 1680 E 2800 N
- 1691 E 2800 N
- 2788 N 1650 E
- 1620 E Hill Field Rd Unit 1
- 1686 E 2800 N
- 2809 Indian Hills Ln
- 2809 N 1775 E
- 2811 N 1650 E
- 2801 N 1650 E
- 1695 E 2800 N
- 2797 N 1650 E
- 2795 Indian Hills Ln
- 2795 N 1775 E
Your Personal Tour Guide
Ask me questions while you tour the home.