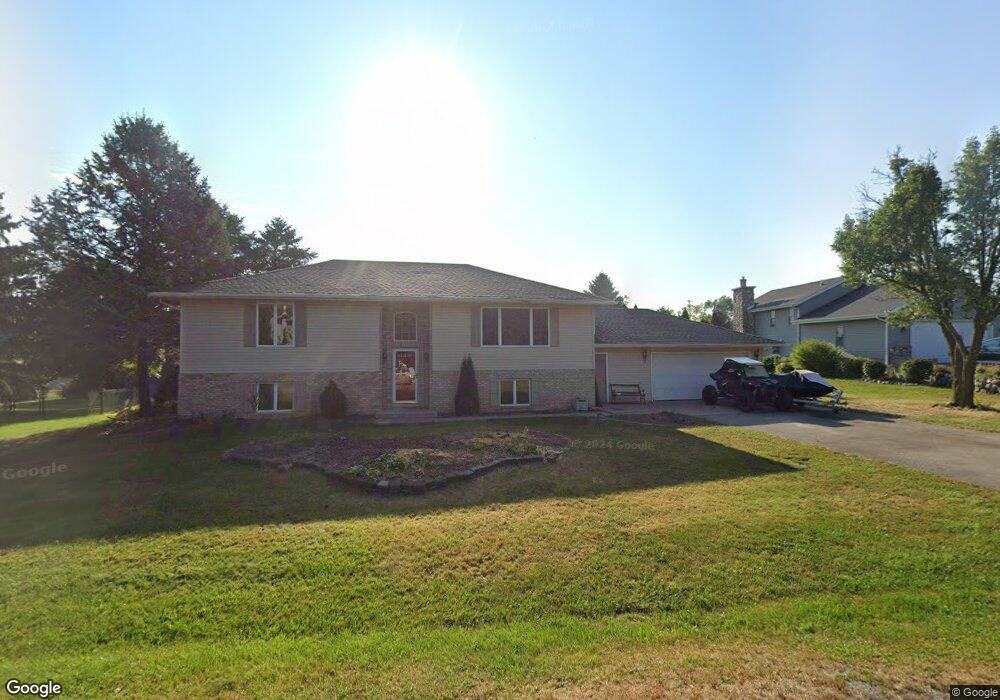
1683 Lyondale Ct Burlington, WI 53105
Estimated Value: $374,000 - $545,000
--
Bed
--
Bath
--
Sq Ft
0.46
Acres
About This Home
This home is located at 1683 Lyondale Ct, Burlington, WI 53105 and is currently estimated at $461,359. 1683 Lyondale Ct is a home located in Walworth County with nearby schools including Lyons Center, Cooper Montessori School, and Nettie E. Karcher School.
Ownership History
Date
Name
Owned For
Owner Type
Purchase Details
Closed on
Jun 18, 2025
Sold by
Denton Christina L and Denton David
Bought by
Denton David and Stice Christina L
Current Estimated Value
Purchase Details
Closed on
Aug 31, 2021
Sold by
Denton David
Bought by
Denton David and Denton Christina L
Purchase Details
Closed on
Dec 20, 2016
Sold by
Department Of Veterans Affairs
Bought by
Denton David
Home Financials for this Owner
Home Financials are based on the most recent Mortgage that was taken out on this home.
Original Mortgage
$206,342
Interest Rate
3.75%
Mortgage Type
FHA
Purchase Details
Closed on
Nov 27, 2009
Sold by
Jurecki James S and Jurecki Denise J
Bought by
Kresken Nicholas
Home Financials for this Owner
Home Financials are based on the most recent Mortgage that was taken out on this home.
Original Mortgage
$88,400
Interest Rate
5.11%
Mortgage Type
FHA
Create a Home Valuation Report for This Property
The Home Valuation Report is an in-depth analysis detailing your home's value as well as a comparison with similar homes in the area
Home Values in the Area
Average Home Value in this Area
Purchase History
| Date | Buyer | Sale Price | Title Company |
|---|---|---|---|
| Denton David | -- | None Listed On Document | |
| Denton David | -- | None Available | |
| Denton David | -- | None Available | |
| Kresken Nicholas | $235,500 | Fidelity Title |
Source: Public Records
Mortgage History
| Date | Status | Borrower | Loan Amount |
|---|---|---|---|
| Previous Owner | Denton David | $206,342 | |
| Previous Owner | Kresken Nicholas | $88,400 |
Source: Public Records
Tax History Compared to Growth
Tax History
| Year | Tax Paid | Tax Assessment Tax Assessment Total Assessment is a certain percentage of the fair market value that is determined by local assessors to be the total taxable value of land and additions on the property. | Land | Improvement |
|---|---|---|---|---|
| 2024 | $4,332 | $291,800 | $52,600 | $239,200 |
| 2023 | $4,421 | $291,800 | $52,600 | $239,200 |
| 2022 | $4,291 | $291,800 | $52,600 | $239,200 |
| 2021 | $4,135 | $203,400 | $46,800 | $156,600 |
| 2020 | $4,129 | $203,400 | $46,800 | $156,600 |
| 2019 | $2,988 | $203,400 | $46,800 | $156,600 |
| 2018 | $2,690 | $203,400 | $46,800 | $156,600 |
| 2017 | $3,807 | $203,400 | $46,800 | $156,600 |
| 2016 | $4,155 | $203,400 | $46,800 | $156,600 |
| 2015 | $4,171 | $203,400 | $46,800 | $156,600 |
| 2014 | $4,651 | $203,400 | $46,800 | $156,600 |
| 2013 | $4,651 | $203,400 | $46,800 | $156,600 |
Source: Public Records
Map
Nearby Homes
- Lt35 Hanson Ct
- Lt36 Hanson Ct
- Lt37 Hanson Ct
- 6104 Water St
- 1519 Center St
- Lt15 Valley Club Dr
- 5804 Wisconsin 36
- 6659 Buckby Rd
- 2211 Sheridan Springs Rd
- 6430 Briarwood Dr
- 1432 Sunrise Trail
- 1455 Greenfield Ave
- Lt5 Briarwood Dr
- Lt18 River Dr
- Lt25 River Dr
- Lt22 River Dr
- Lt6 River Dr
- Lt31 River Dr
- Lt26 River Dr
- Lt4 River Dr
- 1685 Lyondale Ct
- 1673 Lyondale Ct
- 1680 Brandi St
- 1676 Lyondale Ct
- 1668 Brandi St
- 1696 Brandi St
- 1687 Lyondale Ct
- 6026 Spring Valley Rd
- 1657 Lyondale Ct
- 6034 Spring Valley Rd
- 1662 Lyondale Ct
- 1684 Lyondale Ct
- 6038 Spring Valley Rd
- 1658 Brandi St
- 1673 Brandi St
- 1686 Lyondale Ct
- 1671 Mill St
- 1683 Brandi St
- 1688 Lyondale Ct
- 1652 Lyondale Ct