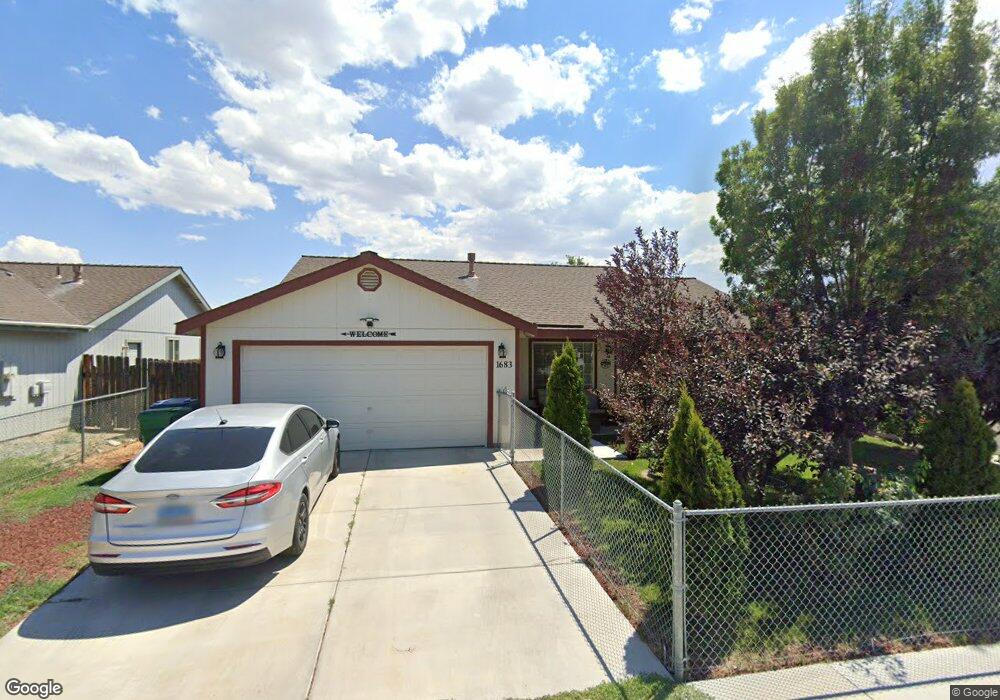
1683 Round up Rd Unit 2 Fernley, NV 89408
Estimated Value: $340,000 - $348,000
3
Beds
2
Baths
1,235
Sq Ft
$279/Sq Ft
Est. Value
About This Home
This home is located at 1683 Round up Rd Unit 2, Fernley, NV 89408 and is currently estimated at $344,693, approximately $279 per square foot. 1683 Round up Rd Unit 2 is a home located in Lyon County with nearby schools including East Valley Elementary School, Fernley Intermediate School, and Fernley High School.
Ownership History
Date
Name
Owned For
Owner Type
Purchase Details
Closed on
Apr 27, 2011
Sold by
Bac Home Loans Servicing Lp
Bought by
Darrough Norma E
Current Estimated Value
Home Financials for this Owner
Home Financials are based on the most recent Mortgage that was taken out on this home.
Original Mortgage
$63,352
Outstanding Balance
$44,769
Interest Rate
5.25%
Mortgage Type
FHA
Estimated Equity
$299,924
Purchase Details
Closed on
Jan 3, 2011
Sold by
Haskins Arlene C and Haskins Richard J
Bought by
Bac Home Loans Servicing Lp and Countrywide Home Loans Servicing Lp
Purchase Details
Closed on
Jan 27, 2006
Sold by
Menyhart Stephen E
Bought by
Haskins Richard J and Haskins Arlene C
Home Financials for this Owner
Home Financials are based on the most recent Mortgage that was taken out on this home.
Original Mortgage
$182,000
Interest Rate
7.62%
Mortgage Type
Purchase Money Mortgage
Create a Home Valuation Report for This Property
The Home Valuation Report is an in-depth analysis detailing your home's value as well as a comparison with similar homes in the area
Home Values in the Area
Average Home Value in this Area
Purchase History
| Date | Buyer | Sale Price | Title Company |
|---|---|---|---|
| Darrough Norma E | $65,000 | Ticor Title Of Nevada Inc | |
| Bac Home Loans Servicing Lp | $70,200 | First American National D | |
| Haskins Richard J | $227,500 | First Centennial Title Co Nv |
Source: Public Records
Mortgage History
| Date | Status | Borrower | Loan Amount |
|---|---|---|---|
| Open | Darrough Norma E | $63,352 | |
| Previous Owner | Haskins Richard J | $182,000 |
Source: Public Records
Tax History Compared to Growth
Tax History
| Year | Tax Paid | Tax Assessment Tax Assessment Total Assessment is a certain percentage of the fair market value that is determined by local assessors to be the total taxable value of land and additions on the property. | Land | Improvement |
|---|---|---|---|---|
| 2025 | $1,242 | $95,204 | $43,750 | $51,454 |
| 2024 | $1,615 | $95,567 | $43,750 | $51,816 |
| 2023 | $1,615 | $92,260 | $43,750 | $48,510 |
| 2022 | $1,526 | $88,463 | $43,750 | $44,713 |
| 2021 | $1,518 | $78,246 | $34,650 | $43,596 |
| 2020 | $1,481 | $76,423 | $34,650 | $41,773 |
| 2019 | $1,466 | $71,778 | $31,500 | $40,278 |
| 2018 | $1,439 | $60,281 | $21,000 | $39,281 |
| 2017 | $1,442 | $52,399 | $13,130 | $39,269 |
| 2016 | $1,261 | $39,829 | $5,780 | $34,049 |
| 2015 | $1,296 | $31,538 | $5,780 | $25,758 |
| 2014 | $1,269 | $24,368 | $5,780 | $18,588 |
Source: Public Records
Map
Nearby Homes
- 1687 Round up Rd
- 572 Spur Way
- 1848 Fort Sutter Blvd Unit Lot 6
- 1844 Fort Sutter Blvd Unit Lot 5
- 533 Dutch Oven Ct Unit 3
- 4521 Madison Rd
- 4531 Mifflin St Unit Lot 28
- 4531 Mifflin St
- Tahoe Plan at Nevada Sky
- Topaz Plan at Nevada Sky
- Washoe Plan at Nevada Sky
- 4520 Mifflin St Unit Lot 1
- 4520 Mifflin St
- 863 Jennys Ln
- 870 Jennys Ln
- 4535 Mifflin St
- 1525 Wrangler Ln
- 4536 Mifflin St Unit Lot 5
- 4536 Mifflin St
- 021 46103
- 1685 Round up Rd
- 1700 Branding Ct Unit 2
- 800 Quarter Horse Way Unit 2
- 802 Quarter Horse Way
- 1702 Branding Ct
- 1684 Round up Rd
- 804 Quarter Horse Way
- 1686 Round up Rd Unit 2
- 1704 Branding Ct
- 1689 Round up Rd
- 1682 Round up Rd
- 1688 Round up Rd Unit 3
- 1680 Round up Rd Unit 2
- 806 Quarter Horse Way Unit 2
- 1706 Branding Ct
- 521 River Ranch Rd
- 519 River Ranch Rd
- 1678 Round up Rd Unit River Ranch subdivis
- 1678 Round up Rd
- 523 River Ranch Rd