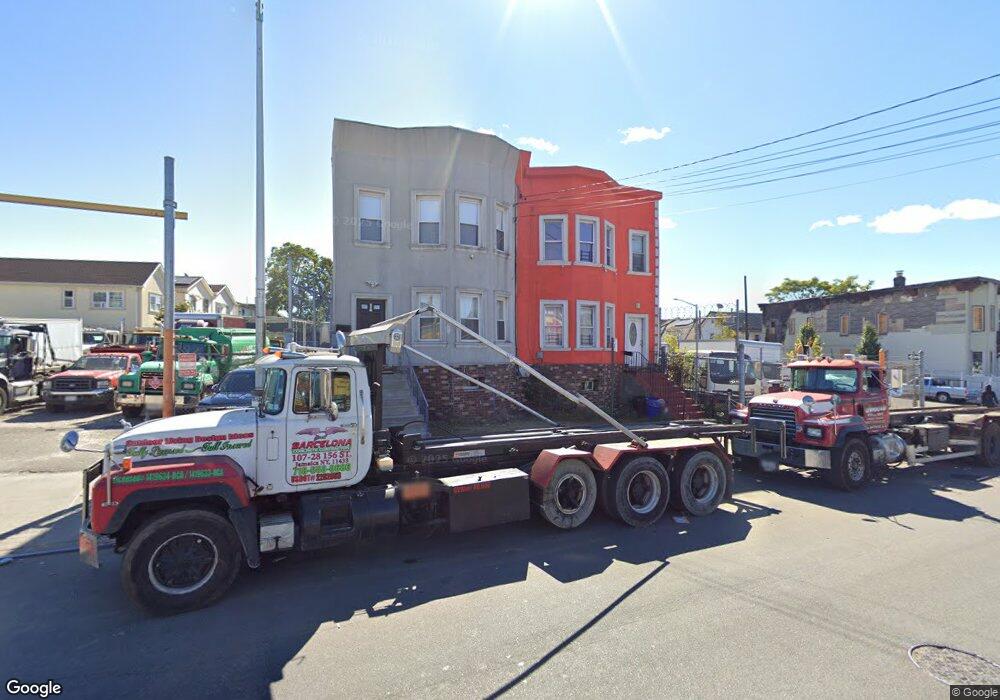
16832 Liberty Ave Jamaica, NY 11433
Jamaica NeighborhoodEstimated Value: $864,911 - $1,164,000
--
Bed
--
Bath
2,100
Sq Ft
$455/Sq Ft
Est. Value
About This Home
This home is located at 16832 Liberty Ave, Jamaica, NY 11433 and is currently estimated at $956,478, approximately $455 per square foot. 16832 Liberty Ave is a home located in Queens County with nearby schools including P.S./I.S. 116 William C Hughley and I.S. 238 Susan B Anthony Academy.
Ownership History
Date
Name
Owned For
Owner Type
Purchase Details
Closed on
Sep 29, 2015
Sold by
Elite Properties Nyc Group Llc
Bought by
Ramanand Ermine
Current Estimated Value
Purchase Details
Closed on
Jun 9, 2015
Sold by
Samuel Easla
Bought by
Elite Properties Nyc Group Llc
Purchase Details
Closed on
Oct 16, 1998
Sold by
Primo Pamela
Bought by
Parker Thedore D
Home Financials for this Owner
Home Financials are based on the most recent Mortgage that was taken out on this home.
Original Mortgage
$184,350
Interest Rate
6.67%
Mortgage Type
FHA
Purchase Details
Closed on
Jun 27, 1995
Sold by
Nice Properties Inc
Bought by
Primo Pamela
Home Financials for this Owner
Home Financials are based on the most recent Mortgage that was taken out on this home.
Original Mortgage
$157,976
Interest Rate
7.49%
Mortgage Type
FHA
Create a Home Valuation Report for This Property
The Home Valuation Report is an in-depth analysis detailing your home's value as well as a comparison with similar homes in the area
Home Values in the Area
Average Home Value in this Area
Purchase History
| Date | Buyer | Sale Price | Title Company |
|---|---|---|---|
| Ramanand Ermine | $555,000 | -- | |
| Elite Properties Nyc Group Llc | $250,000 | -- | |
| Parker Thedore D | $185,000 | -- | |
| Primo Pamela | $159,000 | Commonwealth Land Title Ins |
Source: Public Records
Mortgage History
| Date | Status | Borrower | Loan Amount |
|---|---|---|---|
| Previous Owner | Parker Thedore D | $184,350 | |
| Previous Owner | Primo Pamela | $157,976 |
Source: Public Records
Tax History Compared to Growth
Tax History
| Year | Tax Paid | Tax Assessment Tax Assessment Total Assessment is a certain percentage of the fair market value that is determined by local assessors to be the total taxable value of land and additions on the property. | Land | Improvement |
|---|---|---|---|---|
| 2025 | $4,486 | $22,546 | $6,168 | $16,378 |
| 2024 | $4,486 | $22,334 | $7,114 | $15,220 |
| 2023 | $4,287 | $21,108 | $6,267 | $14,841 |
| 2022 | $3,976 | $47,820 | $15,480 | $32,340 |
| 2021 | $3,954 | $39,660 | $15,480 | $24,180 |
| 2020 | $3,977 | $41,220 | $15,480 | $25,740 |
| 2019 | $3,893 | $38,760 | $15,480 | $23,280 |
| 2018 | $3,586 | $17,590 | $8,118 | $9,472 |
| 2017 | $3,383 | $16,596 | $8,048 | $8,548 |
| 2016 | $3,130 | $16,596 | $8,048 | $8,548 |
| 2015 | $1,888 | $15,657 | $9,372 | $6,285 |
| 2014 | $1,888 | $15,510 | $10,054 | $5,456 |
Source: Public Records
Map
Nearby Homes
- 10315 169th St
- 16905 104th Ave
- 166-12 Douglas Ave
- 16823 93rd Ave
- 168-63 93rd Ave
- 10513 171st St
- 10529 171st St
- 10519 171st Place
- 173-18 103rd Rd
- 172-18 Jamaica Ave Unit 2-B
- 107-06 165th St
- 109-15 Lot A Guy R Brewer Blvd
- 17508 93rd Ave
- 107-54 Merrick Blvd
- 106-49 Guy R Brewer Blvd
- 9118 173rd St
- 17347 105th Ave
- 172-09 108th Ave
- 173-61 105th Ave
- 107-04 Guy R Brewer Blvd Unit 7A
- 16830 Liberty Ave
- 16830 Liberty Ave
- 16836 Liberty Ave
- 16828 Liberty Ave
- 16838 Liberty Ave
- 16826 Liberty Ave
- 10309 168th Place
- 103-09 168th Place
- 103-09 168th Place Unit 2nd Fl
- 103-09 168th Place
- 16840 Liberty Ave
- 10311 168th Place
- 103-11 168th Place
- 168-32 Liberty Ave
- 10312 169th St
- 16842 Liberty Ave
- 103-14 169th St
- 10314 169th St
- 10313 168th Place
- 168-42 Liberty Ave