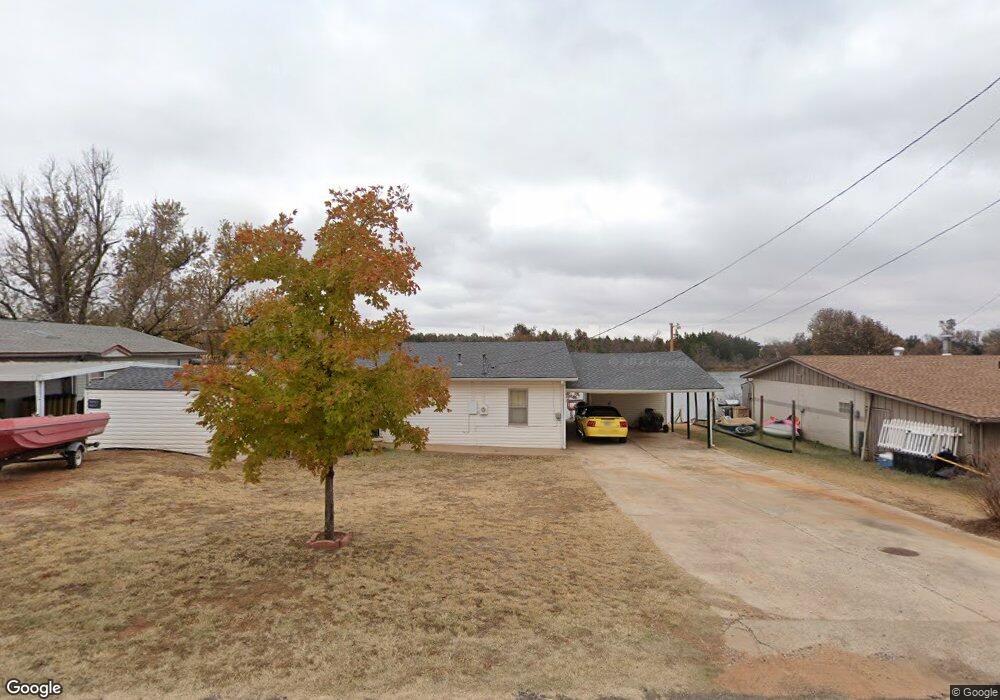
1684 Cherokee Rd Crescent, OK 73028
Estimated Value: $95,918 - $196,000
Studio
--
Bath
1,404
Sq Ft
$100/Sq Ft
Est. Value
About This Home
This home is located at 1684 Cherokee Rd, Crescent, OK 73028 and is currently estimated at $140,230, approximately $99 per square foot. 1684 Cherokee Rd is a home with nearby schools including Crescent Elementary School, Crescent Middle School, and Crescent High School.
Ownership History
Date
Name
Owned For
Owner Type
Purchase Details
Closed on
Aug 22, 2016
Sold by
Sturch Glynis W and Sturch Stephan B
Bought by
Beery Robert D and Beery Allison C
Current Estimated Value
Purchase Details
Closed on
Aug 8, 2016
Sold by
Beery Christopher C
Bought by
Beery Robert D and Beery Allison C
Purchase Details
Closed on
Jul 18, 2016
Sold by
Herndon Shannon Beery and Herndon Henry Hartwell
Bought by
Beery Robert D and Beery Allison C
Purchase Details
Closed on
Jul 7, 2016
Sold by
Beery James Robert and Beery Judith Carey
Bought by
Beery Robert D and Beery Allison C
Purchase Details
Closed on
Jul 5, 2016
Sold by
Beery Tony Alfred and Beery Elizabeth Argaret
Bought by
Beery Robert D and Beery Allison C
Purchase Details
Closed on
Jun 30, 2016
Sold by
Beery Charles and Beery Marilyn
Bought by
Beery Robert D and Beery Allison C
Create a Home Valuation Report for This Property
The Home Valuation Report is an in-depth analysis detailing your home's value as well as a comparison with similar homes in the area
Home Values in the Area
Average Home Value in this Area
Purchase History
| Date | Buyer | Sale Price | Title Company |
|---|---|---|---|
| Beery Robert D | -- | None Available | |
| Beery Robert D | -- | None Available | |
| Beery Robert D | -- | None Available | |
| Beery Robert D | -- | None Available | |
| Beery Robert D | -- | None Available | |
| Beery Robert D | -- | None Available |
Source: Public Records
Tax History
| Year | Tax Paid | Tax Assessment Tax Assessment Total Assessment is a certain percentage of the fair market value that is determined by local assessors to be the total taxable value of land and additions on the property. | Land | Improvement |
|---|---|---|---|---|
| 2025 | $472 | $5,323 | $806 | $4,517 |
| 2024 | $463 | $5,168 | $806 | $4,362 |
| 2023 | $463 | $5,017 | $806 | $4,211 |
| 2022 | $441 | $4,871 | $806 | $4,065 |
| 2021 | $444 | $4,729 | $806 | $3,923 |
| 2020 | $429 | $4,592 | $806 | $3,786 |
| 2019 | $422 | $4,458 | $806 | $3,652 |
| 2018 | $446 | $4,615 | $848 | $3,767 |
| 2017 | $475 | $4,844 | $848 | $3,996 |
| 2016 | $483 | $4,855 | $848 | $4,007 |
| 2014 | $448 | $4,753 | $827 | $3,926 |
| 2013 | $433 | $4,938 | $655 | $4,283 |
Source: Public Records
Map
Nearby Homes
- 0 Cimarron Rd
- 2160 Thunder Dr
- 13642 Jacqueline Dr
- 1 W Cimarron Blvd
- 800 W Cimarron Blvd
- 667 Straight St
- 524 Still Meadows
- 523 Mustard Seed
- 545 Mustard Seed
- 567 Mustard Seed
- 667 Still Meadows
- 601 Still Meadows
- 545 Still Meadows
- 523 Still Meadows
- 501 Still Meadows
- 567 Still Meadows
- 623 Still Meadows
- 645 Still Meadows
- 11723 Narrow Way
- 0000 Highway 74
- 167 Cherokee Rd
- 1700 Cherokee Rd
- 1710 Cherokee Rd
- 1664 Cherokee Rd
- 1634 Cherokee Rd
- 1701 Cherokee Rd
- 1675 Cherokee Rd
- 140 Cherokee Rd
- 1724 Cherokee Rd
- 1688 Concho Rd
- 1725 Trail of Tears Rd
- 1735 Cherokee Rd
- 1731 Trail of Tears Rd
- 1647 Cherokee Rd
- 100 Geronimo Rd
- 1675 Concho Rd
- 104 Trail of Tears Rd
- 301 W Cimarron Blvd
- 1775 Trail of Tears Rd
- 1721 Concho Rd
Your Personal Tour Guide
Ask me questions while you tour the home.