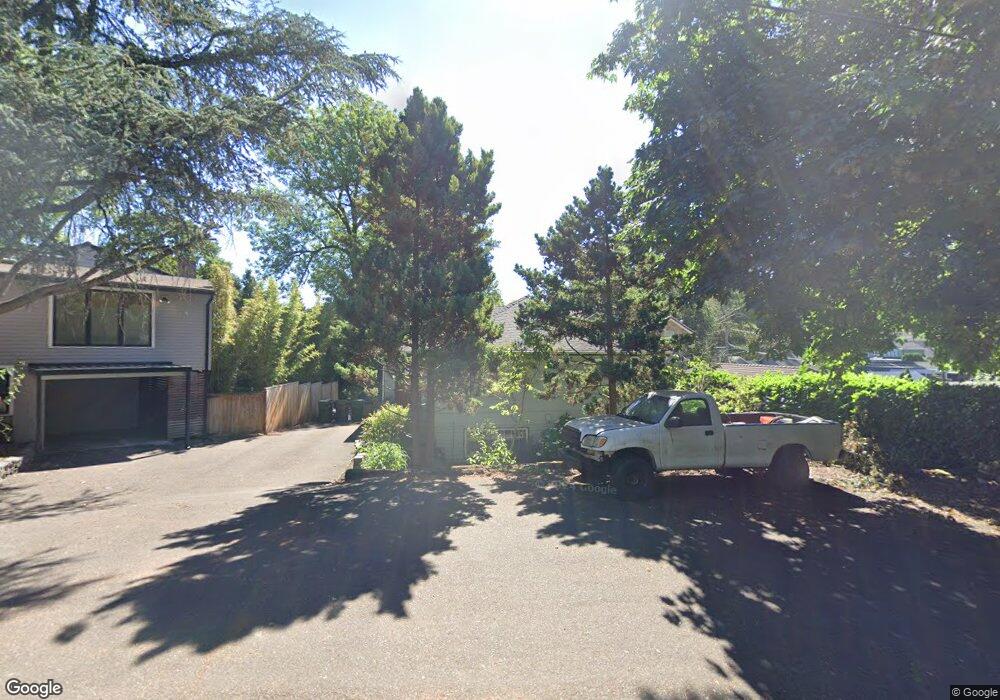
16842 Bryant Rd Lake Oswego, OR 97035
Bryant NeighborhoodEstimated Value: $710,000 - $1,047,000
4
Beds
2
Baths
2,287
Sq Ft
$387/Sq Ft
Est. Value
About This Home
This home is located at 16842 Bryant Rd, Lake Oswego, OR 97035 and is currently estimated at $885,016, approximately $386 per square foot. 16842 Bryant Rd is a home located in Clackamas County with nearby schools including Westridge Elementary School, Lakeridge Middle School, and Lakeridge High School.
Ownership History
Date
Name
Owned For
Owner Type
Purchase Details
Closed on
Mar 30, 2007
Sold by
Craig Chester W and Craig Denise G
Bought by
Craig Chester W and Craig Denise G
Current Estimated Value
Home Financials for this Owner
Home Financials are based on the most recent Mortgage that was taken out on this home.
Original Mortgage
$360,000
Outstanding Balance
$217,179
Interest Rate
6.29%
Mortgage Type
New Conventional
Estimated Equity
$667,837
Purchase Details
Closed on
Jul 15, 1999
Sold by
Glenn Daniel R and Glenn Frances Jo
Bought by
Craig Chester W and Craig Denise G
Home Financials for this Owner
Home Financials are based on the most recent Mortgage that was taken out on this home.
Original Mortgage
$151,950
Interest Rate
7.51%
Purchase Details
Closed on
Aug 7, 1995
Sold by
Glenn Patricia B
Bought by
Glenn Daniel R and Glenn Frances Jo
Home Financials for this Owner
Home Financials are based on the most recent Mortgage that was taken out on this home.
Original Mortgage
$112,100
Interest Rate
7.63%
Create a Home Valuation Report for This Property
The Home Valuation Report is an in-depth analysis detailing your home's value as well as a comparison with similar homes in the area
Home Values in the Area
Average Home Value in this Area
Purchase History
| Date | Buyer | Sale Price | Title Company |
|---|---|---|---|
| Craig Chester W | -- | First American Title Insuran | |
| Craig Chester W | $189,950 | Transnation Title Insurance | |
| Glenn Daniel R | $118,000 | Fidelity National Title Co |
Source: Public Records
Mortgage History
| Date | Status | Borrower | Loan Amount |
|---|---|---|---|
| Open | Craig Chester W | $360,000 | |
| Closed | Craig Chester W | $151,950 | |
| Previous Owner | Glenn Daniel R | $112,100 |
Source: Public Records
Tax History Compared to Growth
Tax History
| Year | Tax Paid | Tax Assessment Tax Assessment Total Assessment is a certain percentage of the fair market value that is determined by local assessors to be the total taxable value of land and additions on the property. | Land | Improvement |
|---|---|---|---|---|
| 2025 | $5,556 | $289,308 | -- | -- |
| 2024 | $5,408 | $280,882 | -- | -- |
| 2023 | $5,408 | $272,701 | $0 | $0 |
| 2022 | $5,093 | $264,759 | $0 | $0 |
| 2021 | $4,704 | $257,048 | $0 | $0 |
| 2020 | $4,586 | $249,562 | $0 | $0 |
| 2019 | $4,473 | $242,294 | $0 | $0 |
| 2018 | $4,254 | $235,237 | $0 | $0 |
| 2017 | $4,105 | $228,385 | $0 | $0 |
| 2016 | $3,737 | $221,733 | $0 | $0 |
| 2015 | $3,610 | $215,275 | $0 | $0 |
| 2014 | $3,564 | $209,005 | $0 | $0 |
Source: Public Records
Map
Nearby Homes
- 4470 Lakeview Blvd
- 4368 Lakeview Blvd
- 4640 Lower Dr
- 4610 Lower Dr
- 4264 Westbay Rd
- 4480 Upper Dr
- 16755 Graef Cir
- 4160 Westbay Rd
- 4241 Cobb Way
- 4971 Lakeview Blvd
- 4224 Haven St
- 5057 W Sunset Dr
- 5189 Rosewood St
- 17367 Canal Cir
- 16061 Waluga Dr
- 5328 Lower Dr
- 17595 Kelok Rd
- 17239 Rebecca Ln
- 17810 Sarah Hill Ln
- 17855 Deerbrush Ave
- 16868 Bryant Rd
- 4490 Lakeview Blvd
- 16948 Bryant Rd
- 4464 Lakeview Blvd
- 16884 Bryant Rd
- 16946 Bryant Rd
- 4434 Lakeview Blvd
- 16803 Bryant Rd
- 16942 Bryant Rd
- 16931 Bryant Rd
- 4424 Lakeview Blvd
- 4501 Lakeview Blvd
- 4516 Lower Dr Unit B4
- 4516 Lower Dr
- 4514 Lower Dr Unit B3
- 4514 Lower Dr
- 4528 Lower Dr Unit A-5
- 4528 Lower Dr
- 4398 Lakeview Blvd
- 4512 Lower Dr Unit B-2