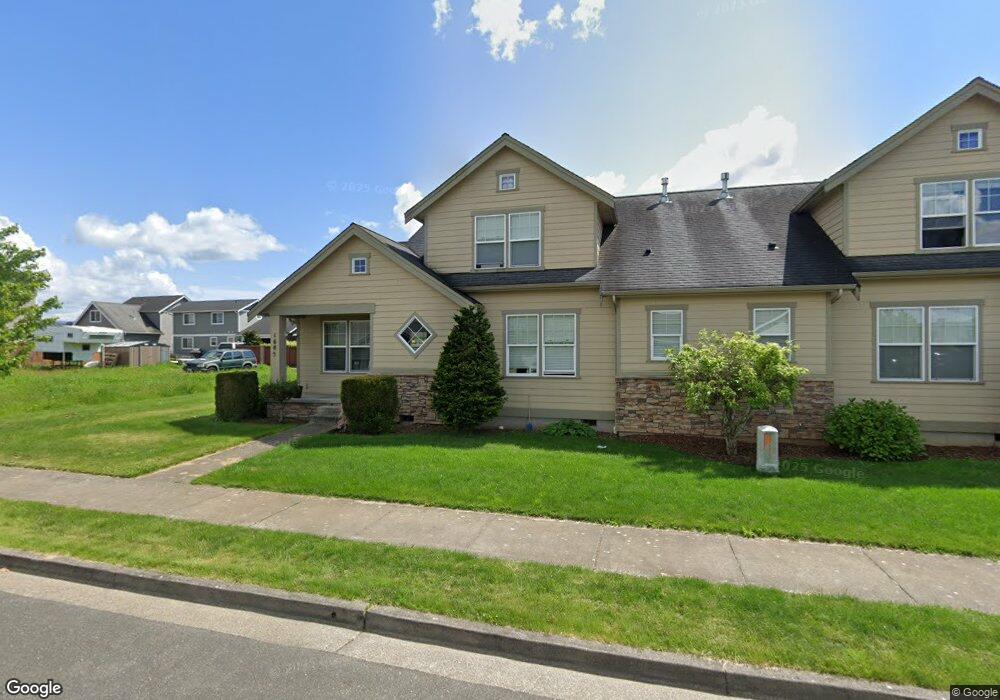
1685 Lexi Loop Lynden, WA 98264
Estimated Value: $512,989 - $559,000
3
Beds
3
Baths
1,492
Sq Ft
$364/Sq Ft
Est. Value
About This Home
This home is located at 1685 Lexi Loop, Lynden, WA 98264 and is currently estimated at $543,247, approximately $364 per square foot. 1685 Lexi Loop is a home located in Whatcom County with nearby schools including Lynden High School, Cornerstone Christian School, and Covenant Christian School.
Ownership History
Date
Name
Owned For
Owner Type
Purchase Details
Closed on
Apr 21, 2014
Sold by
Miller Kelli and Longstreth Kelli Lyn
Bought by
Miller Kelli
Current Estimated Value
Purchase Details
Closed on
Sep 26, 2013
Sold by
Longstreth David C
Bought by
Miller Kelli
Purchase Details
Closed on
Mar 30, 2009
Sold by
Line Road Properties Llc
Bought by
Longstreth David and Longstreth Kelli
Home Financials for this Owner
Home Financials are based on the most recent Mortgage that was taken out on this home.
Original Mortgage
$164,250
Interest Rate
5.04%
Mortgage Type
Purchase Money Mortgage
Create a Home Valuation Report for This Property
The Home Valuation Report is an in-depth analysis detailing your home's value as well as a comparison with similar homes in the area
Home Values in the Area
Average Home Value in this Area
Purchase History
| Date | Buyer | Sale Price | Title Company |
|---|---|---|---|
| Miller Kelli | -- | Vantage Point Title Inc | |
| Miller Kelli | -- | None Available | |
| Longstreth David | $219,280 | Chicago Title Insurance |
Source: Public Records
Mortgage History
| Date | Status | Borrower | Loan Amount |
|---|---|---|---|
| Previous Owner | Longstreth David | $164,250 |
Source: Public Records
Tax History
| Year | Tax Paid | Tax Assessment Tax Assessment Total Assessment is a certain percentage of the fair market value that is determined by local assessors to be the total taxable value of land and additions on the property. | Land | Improvement |
|---|---|---|---|---|
| 2025 | $3,380 | $458,286 | $190,978 | $267,308 |
| 2024 | $3,166 | $445,325 | $169,750 | $275,575 |
| 2023 | $3,166 | $439,976 | $175,000 | $264,976 |
| 2022 | $3,202 | $419,986 | $117,332 | $302,654 |
| 2021 | $3,141 | $347,091 | $96,967 | $250,124 |
| 2020 | $2,752 | $309,911 | $86,580 | $223,331 |
| 2019 | $2,449 | $284,215 | $79,495 | $204,720 |
| 2018 | $2,676 | $259,214 | $72,417 | $186,797 |
| 2017 | $2,295 | $232,666 | $65,000 | $167,666 |
| 2016 | $2,159 | $212,198 | $44,000 | $168,198 |
| 2015 | $1,914 | $198,520 | $42,320 | $156,200 |
| 2014 | -- | $191,798 | $40,880 | $150,918 |
| 2013 | -- | $190,918 | $40,000 | $150,918 |
Source: Public Records
Map
Nearby Homes
- 2102 Shortcake Ln
- 1713 Aaron Dr
- 1725 Aaron Dr
- 2202 Berryman Loop
- 8885 Line Rd
- 2075 Bluestem St
- 1372 Elm St
- 1963 Bluestem St
- 2274 Dogwood St
- 1950 N Prairie Ln
- 1979 Woodsman Dr
- 1580 Foxtail St
- 1949 Junegrass Dr
- 1660 Eastwood Way
- 1484 Larkspur St
- 1171 Elm St
- 2027 Steelhead Way
- 2120 Lagerwey Cir
- 2178 Lagerwey Cir
- 1125 N Cascade Ct
- 1691 Lexi Loop
- 1613 Lexi Loop Unit LP
- 1613 Lexi Loop
- 1605 Lexi Loop
- 1621 Lexi Loop Unit LP
- 1696 Lexi Loop
- 1696 Lexi Loop Unit LP
- 1698 Lexi Loop
- 1692 Lexi Loop
- 1629 Lexi Loop
- 1653 Lexi Loop
- 2145 Mercedes Dr
- 1684 Lexi Loop
- 2151 Mercedes Dr
- 2139 Mercedes Dr
- 2186 Mercedes Dr
- 2157 Mercedes Dr
- 2133 Mercedes Dr
Your Personal Tour Guide
Ask me questions while you tour the home.