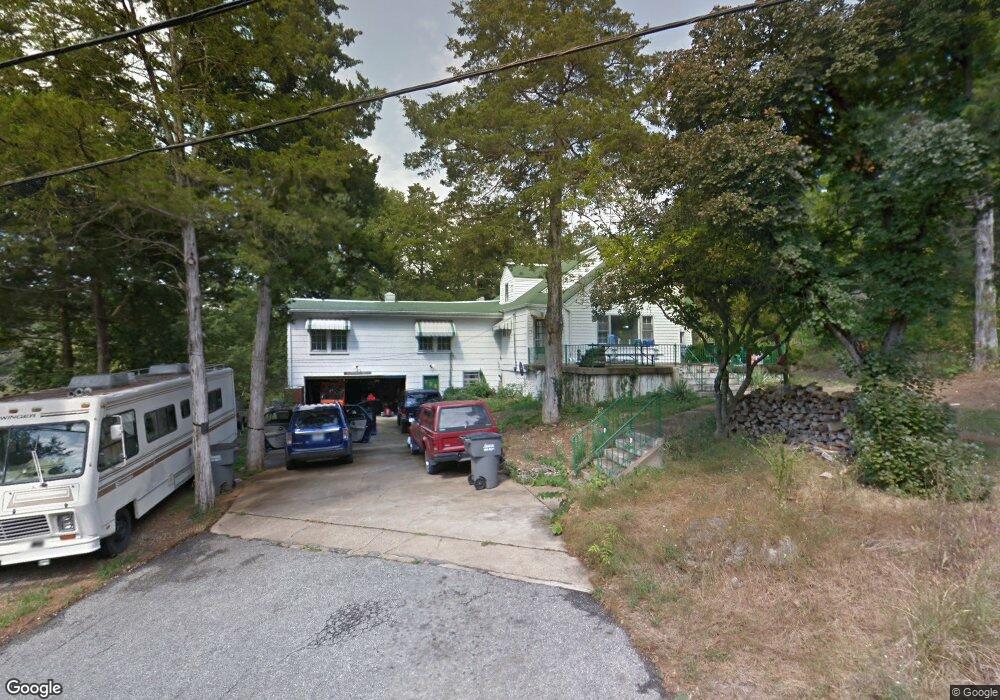
1685 Union Rd Barnhart, MO 63012
Estimated Value: $235,616 - $447,000
Studio
1
Bath
2,402
Sq Ft
$146/Sq Ft
Est. Value
About This Home
This home is located at 1685 Union Rd, Barnhart, MO 63012 and is currently estimated at $349,654, approximately $145 per square foot. 1685 Union Rd is a home with nearby schools including Windsor High School and St. Joseph Catholic School.
Ownership History
Date
Name
Owned For
Owner Type
Purchase Details
Closed on
Jul 19, 2021
Sold by
Price Stuart T
Bought by
Govro Kimberly Dawn
Current Estimated Value
Home Financials for this Owner
Home Financials are based on the most recent Mortgage that was taken out on this home.
Original Mortgage
$192,000
Outstanding Balance
$174,290
Interest Rate
2.93%
Mortgage Type
New Conventional
Estimated Equity
$175,364
Purchase Details
Closed on
Mar 16, 2020
Sold by
Price Robert Y and Price Geroge S
Bought by
Price Stuart T
Home Financials for this Owner
Home Financials are based on the most recent Mortgage that was taken out on this home.
Original Mortgage
$93,100
Interest Rate
3.4%
Mortgage Type
New Conventional
Purchase Details
Closed on
Oct 31, 2016
Sold by
Homer Price Est Llc
Bought by
Price George S and The George S Price Revocable L
Purchase Details
Closed on
Oct 21, 2005
Sold by
Price John V
Bought by
Homer V Price Est Llc
Create a Home Valuation Report for This Property
The Home Valuation Report is an in-depth analysis detailing your home's value as well as a comparison with similar homes in the area
Home Values in the Area
Average Home Value in this Area
Purchase History
| Date | Buyer | Sale Price | Title Company |
|---|---|---|---|
| Govro Kimberly Dawn | -- | None Available | |
| Price Stuart T | -- | Stc | |
| Price George S | -- | None Available | |
| Homer V Price Est Llc | -- | -- |
Source: Public Records
Mortgage History
| Date | Status | Borrower | Loan Amount |
|---|---|---|---|
| Open | Govro Kimberly Dawn | $192,000 | |
| Previous Owner | Price Stuart T | $93,100 |
Source: Public Records
Tax History
| Year | Tax Paid | Tax Assessment Tax Assessment Total Assessment is a certain percentage of the fair market value that is determined by local assessors to be the total taxable value of land and additions on the property. | Land | Improvement |
|---|---|---|---|---|
| 2025 | $2,484 | $36,800 | $3,300 | $33,500 |
| 2024 | $2,484 | $33,900 | $3,300 | $30,600 |
| 2023 | $2,484 | $33,900 | $3,300 | $30,600 |
| 2022 | $2,121 | $29,000 | $3,300 | $25,700 |
| 2021 | $2,122 | $29,000 | $3,300 | $25,700 |
| 2020 | $1,983 | $26,300 | $3,000 | $23,300 |
| 2019 | $1,981 | $26,300 | $3,000 | $23,300 |
| 2018 | $1,954 | $26,300 | $3,000 | $23,300 |
| 2017 | $1,880 | $26,300 | $3,000 | $23,300 |
| 2016 | $1,686 | $23,500 | $3,000 | $20,500 |
| 2015 | $1,681 | $23,500 | $3,000 | $20,500 |
| 2013 | -- | $22,100 | $2,800 | $19,300 |
Source: Public Records
Map
Nearby Homes
- 1660 Old State Road M
- 36 Huntleigh Woods
- 0 Hwy Mm Unit MAR24032005
- 1675 Old State Road M
- 1433 Hoover Dr
- 0 New Highway M Unit MAR25024234
- 2149 Meadow Dr
- 7255 Meriwether Ct
- 2338 Windsor Castle Dr
- 7511 Hillcress Ct
- 7406 Avondale Park
- 6027 Kensington Way
- 1702 Springbrook Dr
- 5863 Mayberry Dr
- 0 Unknown Unit MIS25074446
- 0 Unknown Unit MIS26008567
- 0 Unknown Unit MIS25074450
- 0 Unknown Unit MIS25074289
- 0 Unknown Unit MIS25074494
- 0 Unknown Unit MIS25074457
- 1684 Union Rd
- 1686 Union Rd
- 6702 Haven Hill Rd
- 1693 Union Rd
- 6695 Haven Hill Rd
- 6637 Gabriel Dr
- 6626 Gabriel Dr
- 6633 Gabriel Dr
- 6708 Loveless Rd
- 6705 Haven Hill Rd
- 6691 Haven Hill Rd
- 1696 Union Rd
- 6706 Haven Hill Rd
- 6720 Loveless Rd
- 6651 Haven Hill Rd
- 1707 Stahl Rd Unit M
- 6630 Dry Creek Rd
- 6622 Gabriel Dr
- 6635 Dry Creek Rd
- 6624 Dry Creek Rd
Your Personal Tour Guide
Ask me questions while you tour the home.