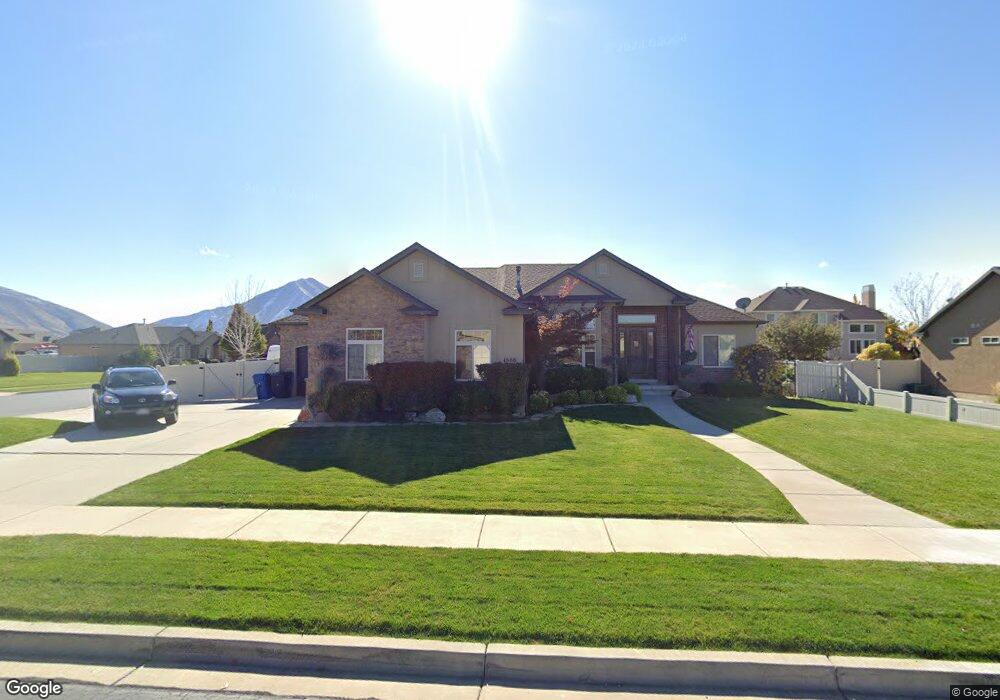
1686 E 390 N Spanish Fork, UT 84660
Estimated Value: $668,000 - $747,654
3
Beds
3
Baths
3,720
Sq Ft
$193/Sq Ft
Est. Value
About This Home
This home is located at 1686 E 390 N, Spanish Fork, UT 84660 and is currently estimated at $718,551, approximately $193 per square foot. 1686 E 390 N is a home located in Utah County with nearby schools including Sierra Bonita Elementary School, Mapleton Junior High School, and Maple Mountain High School.
Ownership History
Date
Name
Owned For
Owner Type
Purchase Details
Closed on
Jan 26, 2015
Sold by
Roberts Brian Workman and Roberts Kari Ann
Bought by
Roberts Brian Workman and Roberts Kari Ann
Current Estimated Value
Home Financials for this Owner
Home Financials are based on the most recent Mortgage that was taken out on this home.
Original Mortgage
$248,000
Outstanding Balance
$189,879
Interest Rate
3.75%
Mortgage Type
New Conventional
Estimated Equity
$528,672
Purchase Details
Closed on
Feb 3, 2010
Sold by
Marshall Blair Kim
Bought by
Roberts Brian Workman and Roberts Kari Ann
Home Financials for this Owner
Home Financials are based on the most recent Mortgage that was taken out on this home.
Original Mortgage
$265,109
Interest Rate
5.5%
Mortgage Type
FHA
Purchase Details
Closed on
Apr 27, 2007
Sold by
Sunrise Ridge At Springville Llc
Bought by
Marshall Blair Kim
Create a Home Valuation Report for This Property
The Home Valuation Report is an in-depth analysis detailing your home's value as well as a comparison with similar homes in the area
Home Values in the Area
Average Home Value in this Area
Purchase History
| Date | Buyer | Sale Price | Title Company |
|---|---|---|---|
| Roberts Brian Workman | -- | Meridian Title Co | |
| Roberts Brian Workman | -- | Cornerstone Title Insurance | |
| Marshall Blair Kim | -- | Title West Title Company |
Source: Public Records
Mortgage History
| Date | Status | Borrower | Loan Amount |
|---|---|---|---|
| Open | Roberts Brian Workman | $248,000 | |
| Closed | Roberts Brian Workman | $265,109 |
Source: Public Records
Tax History
| Year | Tax Paid | Tax Assessment Tax Assessment Total Assessment is a certain percentage of the fair market value that is determined by local assessors to be the total taxable value of land and additions on the property. | Land | Improvement |
|---|---|---|---|---|
| 2025 | $3,272 | $378,675 | -- | -- |
| 2024 | $3,272 | $337,260 | $0 | $0 |
| 2023 | $3,327 | $343,310 | $0 | $0 |
| 2022 | $3,298 | $333,740 | $0 | $0 |
| 2021 | $2,831 | $458,400 | $145,400 | $313,000 |
| 2020 | $2,631 | $414,200 | $132,200 | $282,000 |
| 2019 | $2,420 | $400,700 | $123,800 | $276,900 |
| 2018 | $2,351 | $376,400 | $113,300 | $263,100 |
| 2017 | $2,364 | $203,390 | $0 | $0 |
| 2016 | $2,284 | $193,930 | $0 | $0 |
| 2015 | $2,091 | $175,395 | $0 | $0 |
| 2014 | $2,083 | $175,395 | $0 | $0 |
Source: Public Records
Map
Nearby Homes
- 1495 E 400 N
- 1005 E 260 N Unit 20
- 2137 E 200 N Unit MSF53
- 2138 E 200 N Unit MSF54
- 2163 E 200 N Unit MSF52
- 1025 E 360 N Unit 5
- 1022 E 360 N Unit 27
- 991 E 360 N Unit 8
- 663 N 2040 E
- 2117 E 130 N Unit 59
- 1455 E 100 S
- 2155 E 130 N Unit 57
- 2131 E 130 N Unit 58
- 2283 E 400 N Unit 33
- 2271 E 400 N Unit 32
- 1261 E 680 N
- 1238 E 680 N
- 453 N 1210 E
- 53 S 2000 E
- 1815 E 160 S
- 1652 E 390 N Unit 29
- 1652 E 390 N
- 1683 E 320 N
- 1649 E 320 N Unit 26
- 348 N 1690 E
- 1687 E 390 N Unit 31
- 1687 E 390 N
- 388 N 1690 E
- 1653 E 390 N Unit 30
- 1634 E 390 N
- 332 N 1690 E Unit 4
- 332 N 1690 E
- 382 N 1690 E Unit 81
- 382 N 1690 E Unit 1
- 1633 E 320 N
- 392 N 1690 E Unit 2
- 392 N 1690 E Unit 1
- 392 N 1690 E
- 1637 E 390 N
- 293 N 1690 E
Your Personal Tour Guide
Ask me questions while you tour the home.