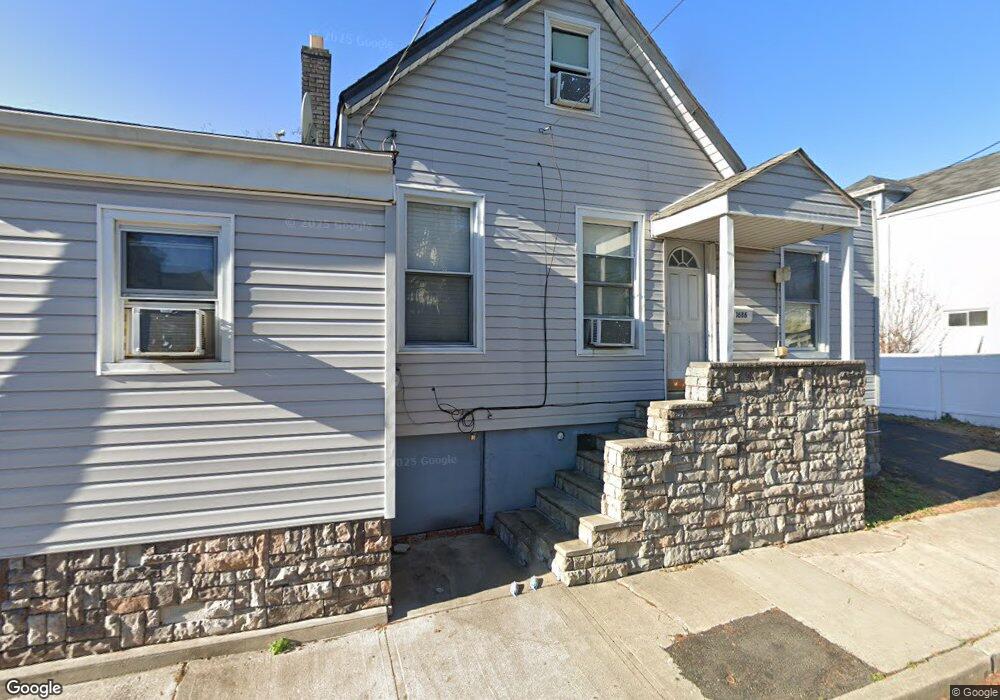
1686 Winfield St Rahway, NJ 07065
Estimated Value: $273,000 - $351,078
3
Beds
2
Baths
766
Sq Ft
$413/Sq Ft
Est. Value
About This Home
This home is located at 1686 Winfield St, Rahway, NJ 07065 and is currently estimated at $316,359, approximately $413 per square foot. 1686 Winfield St is a home located in Union County with nearby schools including Rahway High School and Mother Seton Regional High School.
Ownership History
Date
Name
Owned For
Owner Type
Purchase Details
Closed on
Mar 4, 2011
Sold by
U S Bank National Association
Bought by
Santiago Juan and Santiago Lisa Perez
Current Estimated Value
Purchase Details
Closed on
Nov 17, 2009
Sold by
Walker Qiana and Walker Lamonte E
Bought by
Us Bank National Association
Purchase Details
Closed on
Jul 7, 2006
Sold by
Corbin Stephanie R
Bought by
Walker Qiana
Home Financials for this Owner
Home Financials are based on the most recent Mortgage that was taken out on this home.
Original Mortgage
$155,000
Interest Rate
8.25%
Mortgage Type
Adjustable Rate Mortgage/ARM
Purchase Details
Closed on
Aug 26, 2003
Sold by
Vasilakos Kristina
Bought by
Corbin Stephanie
Home Financials for this Owner
Home Financials are based on the most recent Mortgage that was taken out on this home.
Original Mortgage
$129,945
Interest Rate
6.43%
Create a Home Valuation Report for This Property
The Home Valuation Report is an in-depth analysis detailing your home's value as well as a comparison with similar homes in the area
Home Values in the Area
Average Home Value in this Area
Purchase History
| Date | Buyer | Sale Price | Title Company |
|---|---|---|---|
| Santiago Juan | $40,000 | Land Title Services | |
| Us Bank National Association | -- | None Available | |
| Walker Qiana | -- | -- | |
| Corbin Stephanie | $132,500 | -- |
Source: Public Records
Mortgage History
| Date | Status | Borrower | Loan Amount |
|---|---|---|---|
| Previous Owner | Walker Qiana | $155,000 | |
| Previous Owner | Corbin Stephanie | $129,945 |
Source: Public Records
Tax History Compared to Growth
Tax History
| Year | Tax Paid | Tax Assessment Tax Assessment Total Assessment is a certain percentage of the fair market value that is determined by local assessors to be the total taxable value of land and additions on the property. | Land | Improvement |
|---|---|---|---|---|
| 2025 | $5,517 | $74,500 | $42,900 | $31,600 |
| 2024 | $5,343 | $74,500 | $42,900 | $31,600 |
| 2023 | $5,343 | $74,500 | $42,900 | $31,600 |
| 2022 | $5,231 | $74,500 | $42,900 | $31,600 |
| 2021 | $5,179 | $74,500 | $42,900 | $31,600 |
| 2020 | $5,159 | $74,500 | $42,900 | $31,600 |
| 2019 | $5,094 | $74,500 | $42,900 | $31,600 |
| 2018 | $4,986 | $74,500 | $42,900 | $31,600 |
| 2017 | $4,863 | $74,500 | $42,900 | $31,600 |
| 2016 | $4,760 | $74,500 | $42,900 | $31,600 |
| 2015 | $4,706 | $74,500 | $42,900 | $31,600 |
| 2014 | $4,622 | $74,500 | $42,900 | $31,600 |
Source: Public Records
Map
Nearby Homes
- 554 Harrison St
- 1751 Oliver St Unit 59
- 1751 Oliver St Unit 1759
- 403 Seminary Ave
- 712 Kaminski Dr
- 380 Seminary Ave
- 1489 Jefferson Ave
- 826 W Scott Ave
- 2000 Whittier St
- 770 Stone St
- 1062 Westfield Ave
- 173 W Main St Unit 7
- 272 Egolf Dr
- 2184 Evans St Unit 1
- 1166 Jefferson Ave
- 1151 Charlotte Place
- 244 W Scott Ave Unit 2
- 1374 Lambert St
- 910 Apgar Terrace
- 91 Elm Ave
- 1696 Winfield St
- 707 W Grand Ave
- 699 W Grand Ave
- 691 W Grand Ave Unit 95
- 1691 Winfield St
- 679 W Grand Ave
- 679 W Grand Ave Unit 1
- 1714 Winfield St
- 710 Union St
- 720 Union St
- 688 Union St
- 728 Union St
- 667 W Grand Ave
- 678 Union St
- 692 W Grand Ave Unit 2
- 692 W Grand Ave Unit 1
- 663 W Grand Ave
- 738 Union St
- 655 W Grand Ave
- 668 Union St