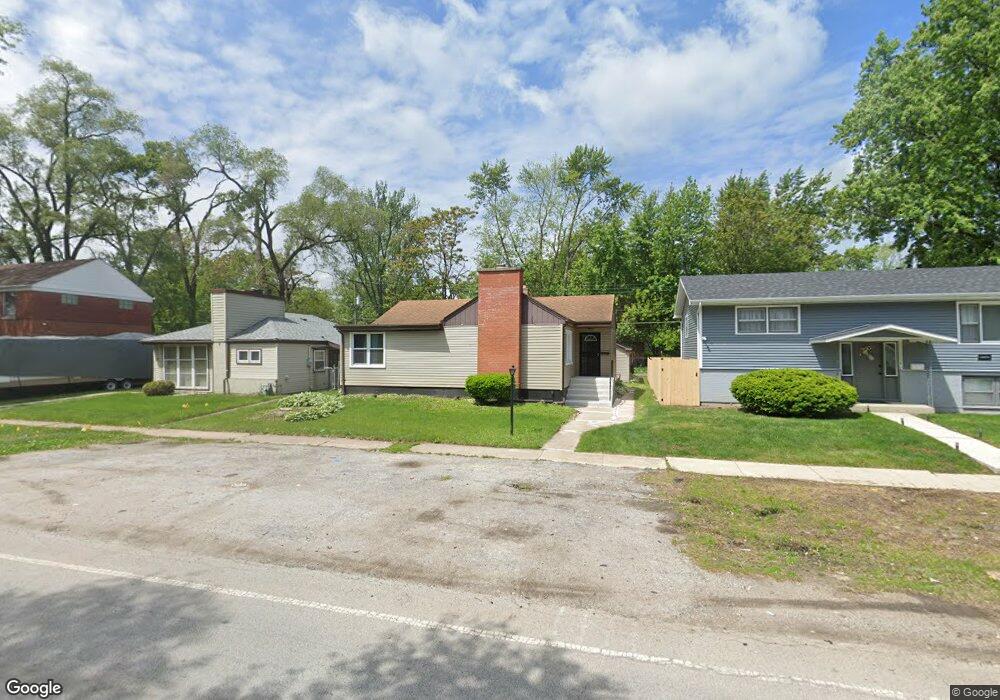
16862 Dixie Hwy Hazel Crest, IL 60429
Hazel Crest Proper NeighborhoodEstimated Value: $89,000 - $226,000
3
Beds
1
Bath
1,088
Sq Ft
$143/Sq Ft
Est. Value
About This Home
This home is located at 16862 Dixie Hwy, Hazel Crest, IL 60429 and is currently estimated at $155,856, approximately $143 per square foot. 16862 Dixie Hwy is a home located in Cook County with nearby schools including Thornwood High School.
Ownership History
Date
Name
Owned For
Owner Type
Purchase Details
Closed on
Feb 7, 2025
Sold by
Enriquez Adolfo
Bought by
Happy New Day Holdings Llc
Current Estimated Value
Home Financials for this Owner
Home Financials are based on the most recent Mortgage that was taken out on this home.
Original Mortgage
$161,250
Outstanding Balance
$160,296
Interest Rate
6.93%
Mortgage Type
Credit Line Revolving
Estimated Equity
-$4,440
Purchase Details
Closed on
Oct 7, 2024
Sold by
Anderson Monte C and Anderson Deborah Mason
Bought by
Enriquez Adolfo
Home Financials for this Owner
Home Financials are based on the most recent Mortgage that was taken out on this home.
Original Mortgage
$140,000
Interest Rate
6.08%
Mortgage Type
Construction
Purchase Details
Closed on
Jul 6, 1995
Sold by
Anderson Monte C and Anderson Deborah Mason
Bought by
Anderson Monte C and Anderson Deborah Mason
Create a Home Valuation Report for This Property
The Home Valuation Report is an in-depth analysis detailing your home's value as well as a comparison with similar homes in the area
Home Values in the Area
Average Home Value in this Area
Purchase History
| Date | Buyer | Sale Price | Title Company |
|---|---|---|---|
| Happy New Day Holdings Llc | -- | Fidelity National Title | |
| Enriquez Adolfo | $95,000 | None Listed On Document | |
| Anderson Monte C | -- | -- |
Source: Public Records
Mortgage History
| Date | Status | Borrower | Loan Amount |
|---|---|---|---|
| Open | Happy New Day Holdings Llc | $161,250 | |
| Previous Owner | Enriquez Adolfo | $140,000 |
Source: Public Records
Tax History Compared to Growth
Tax History
| Year | Tax Paid | Tax Assessment Tax Assessment Total Assessment is a certain percentage of the fair market value that is determined by local assessors to be the total taxable value of land and additions on the property. | Land | Improvement |
|---|---|---|---|---|
| 2024 | $1,871 | $6,900 | $1,998 | $4,902 |
| 2023 | $979 | $6,900 | $1,998 | $4,902 |
| 2022 | $979 | $5,236 | $1,713 | $3,523 |
| 2021 | $1,042 | $5,235 | $1,712 | $3,523 |
| 2020 | $1,193 | $5,235 | $1,712 | $3,523 |
| 2019 | $3,612 | $8,048 | $1,569 | $6,479 |
| 2018 | $3,511 | $8,048 | $1,569 | $6,479 |
| 2017 | $3,441 | $8,048 | $1,569 | $6,479 |
| 2016 | $4,709 | $6,968 | $1,427 | $5,541 |
| 2015 | $5,063 | $7,722 | $1,427 | $6,295 |
| 2014 | $5,000 | $7,722 | $1,427 | $6,295 |
| 2013 | $3,601 | $6,098 | $1,427 | $4,671 |
Source: Public Records
Map
Nearby Homes
- 16918 Shea Ave
- 16930 Winchester Ave
- 16910 Lincoln St
- 16840 Bulger Ave
- 16963 Winchester Ave
- 2030 170th St
- 16768 Bulger Ave
- 1913 170th St
- 17026 Bulger Ave
- 16879 Head Ave
- 17046 Winchester Ave
- 16707 Dixie Hwy
- 16876 Head Ave
- 16744 Trapet Ave
- 2131 170th St
- 16780 Head Ave
- 16927 Crane Ave
- 16727 Head Ave
- 16919 Wood St
- 16726 Head Ave
- 16862 Dixie Hwy
- 16870 Dixie Hwy
- 16870 Dixie Hwy
- 16846 Dixie Hwy
- 16846 Dixie Hwy
- 16846 Dixie Hwy
- 16846 Dixie Hwy
- 16846 Dixie Hwy
- 16876 Dixie Hwy
- 16876 Dixie Hwy
- 16884 Dixie Hwy
- 16884 Dixie Hwy
- 16865 Shea Ave
- 16861 Shea Ave
- 16875 Shea Ave
- 16842 Dixie Hwy
- 16842 Dixie Hwy
- 16881 Shea Ave
- 16849 Shea Ave
- 16841 Shea Ave