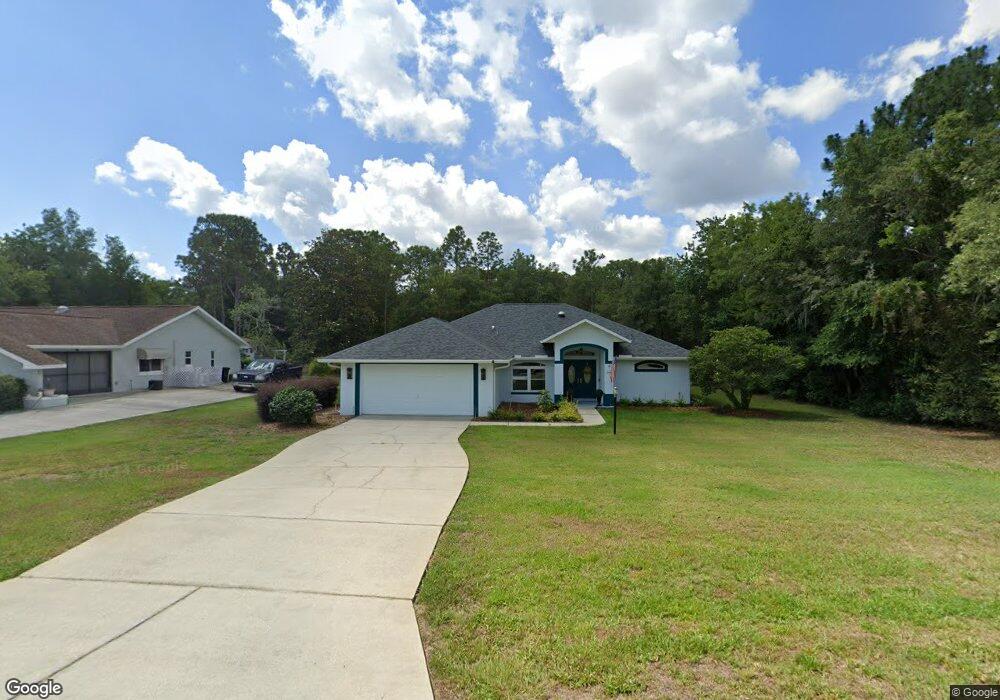
1688 E Saint James Loop Inverness, FL 34453
Estimated Value: $329,329 - $392,000
3
Beds
3
Baths
1,745
Sq Ft
$204/Sq Ft
Est. Value
About This Home
This home is located at 1688 E Saint James Loop, Inverness, FL 34453 and is currently estimated at $355,582, approximately $203 per square foot. 1688 E Saint James Loop is a home located in Citrus County with nearby schools including Hernando Elementary School, Inverness Middle School, and Citrus High School.
Ownership History
Date
Name
Owned For
Owner Type
Purchase Details
Closed on
Aug 12, 2022
Sold by
Meister James W and Meister Diana K
Bought by
Meister James W and Meister Diana K
Current Estimated Value
Purchase Details
Closed on
Nov 19, 2008
Sold by
Siegel John D and Siegel Kimberly L
Bought by
Meister James W and Meister Diana K
Home Financials for this Owner
Home Financials are based on the most recent Mortgage that was taken out on this home.
Original Mortgage
$136,000
Interest Rate
5.89%
Mortgage Type
Purchase Money Mortgage
Purchase Details
Closed on
Sep 3, 2004
Sold by
Bradlee Kevin E and Bradlee Monica
Bought by
Siegel John D
Home Financials for this Owner
Home Financials are based on the most recent Mortgage that was taken out on this home.
Original Mortgage
$133,600
Interest Rate
5.78%
Mortgage Type
Purchase Money Mortgage
Purchase Details
Closed on
May 1, 1996
Bought by
Meister James W and Meister Diana K
Create a Home Valuation Report for This Property
The Home Valuation Report is an in-depth analysis detailing your home's value as well as a comparison with similar homes in the area
Home Values in the Area
Average Home Value in this Area
Purchase History
| Date | Buyer | Sale Price | Title Company |
|---|---|---|---|
| Meister James W | $100 | None Listed On Document | |
| Meister James W | $170,000 | Citrus Land Title Llc | |
| Siegel John D | $167,000 | Citrus Land Title | |
| Meister James W | $19,700 | -- |
Source: Public Records
Mortgage History
| Date | Status | Borrower | Loan Amount |
|---|---|---|---|
| Previous Owner | Meister James W | $136,000 | |
| Previous Owner | Siegel John D | $133,600 |
Source: Public Records
Tax History
| Year | Tax Paid | Tax Assessment Tax Assessment Total Assessment is a certain percentage of the fair market value that is determined by local assessors to be the total taxable value of land and additions on the property. | Land | Improvement |
|---|---|---|---|---|
| 2025 | $1,530 | $136,931 | -- | -- |
| 2024 | $1,487 | $133,072 | -- | -- |
| 2023 | $1,487 | $129,196 | $0 | $0 |
| 2022 | $1,391 | $125,433 | $0 | $0 |
| 2021 | $1,334 | $121,780 | $0 | $0 |
| 2020 | $1,271 | $156,839 | $11,750 | $145,089 |
| 2019 | $1,251 | $146,779 | $11,750 | $135,029 |
| 2018 | $1,221 | $135,647 | $11,750 | $123,897 |
| 2017 | $1,213 | $112,840 | $8,910 | $103,930 |
| 2016 | $1,222 | $110,519 | $10,840 | $99,679 |
| 2015 | $1,237 | $109,751 | $13,360 | $96,391 |
| 2014 | $1,259 | $108,880 | $13,632 | $95,248 |
Source: Public Records
Map
Nearby Homes
- 1843 E Saint James Loop
- 1502 N Popcorn Point
- 1373 N Mediterranean Way
- 1455 E Hartford St
- 2060 E Mary Lue St
- 1473 E Saint Charles Place
- 2159 E Harley St
- 1885 E Monopoly Loop
- 1329 N Mediterranean Way
- 2028 & 2006 N Watkins Point
- 1876 E Monopoly Loop
- 2003 E Cambridge Ln
- 1191 N Chance Way
- 2180 & 2152 N Page Ave
- 1464 N Hambletonian Dr
- 2155 E Cambridge Ln
- 1995 E Newhaven St
- 1163 E Canvas Ln
- 1108 E Van Gogh Ct
- 1085 N Spend A Buck Dr
- 1688 E James Lp St
- 1664 E James St
- 1704 E Saint James Loop
- 1664 E Saint James Loop
- 1664 E St James Loop
- 1704 E St James Loop
- 1648 E St James Loop
- 1648 E Saint James Loop
- 1689 E Pacific Ln
- 1653 E Pacific Ln
- 1642 N Baltic Terrace
- 1675 E Saint James Loop
- 1695 E Saint James Loop
- 1604 N Baltic Terrace
- 1626 E Saint James Loop
- 1657 E St James Loop
- 1715 E Saint James Loop
- 1580 N Baltic Terrace
- 1631 E Pacific Ln
Your Personal Tour Guide
Ask me questions while you tour the home.