Estimated Value: $922,000 - $1,267,533
7
Beds
4
Baths
6,365
Sq Ft
$173/Sq Ft
Est. Value
About This Home
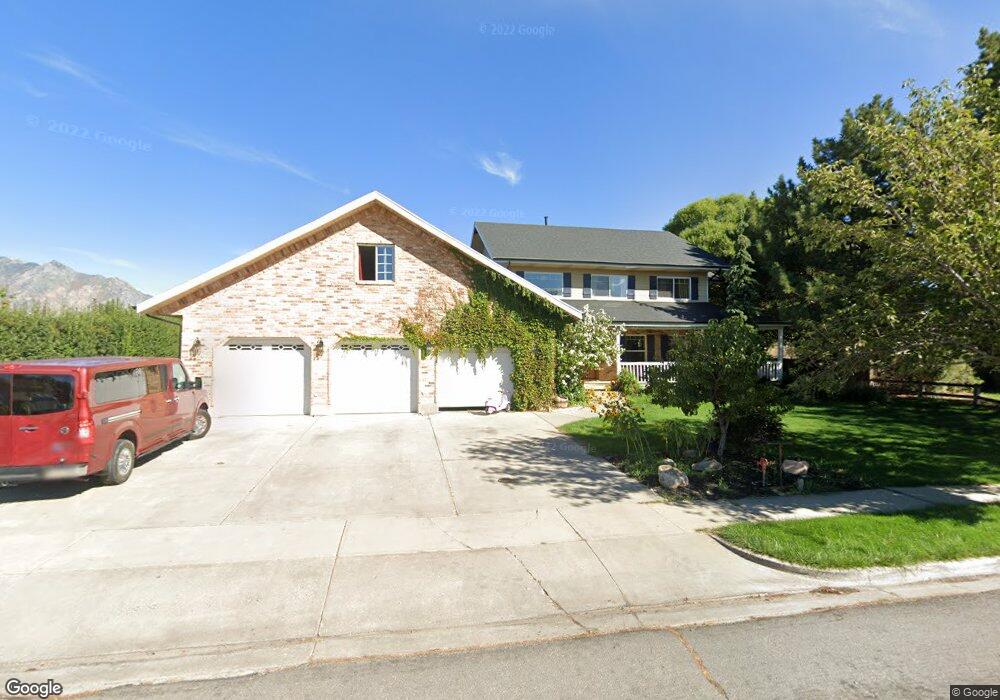
This home is located at 1688 N 1400 E, Lehi, UT 84043 and is currently estimated at $1,098,633, approximately $172 per square foot. 1688 N 1400 E is a home located in Utah County with nearby schools including Freedom Elementary School, Lehi Junior High School, and Skyridge High School.
Ownership History
Date
Name
Owned For
Owner Type
Purchase Details
Closed on
May 29, 2020
Sold by
Millward Travis
Bought by
Millward Travis and Millward Mary
Current Estimated Value
Home Financials for this Owner
Home Financials are based on the most recent Mortgage that was taken out on this home.
Original Mortgage
$510,000
Outstanding Balance
$356,891
Interest Rate
3%
Mortgage Type
New Conventional
Estimated Equity
$741,742
Purchase Details
Closed on
Jun 27, 2016
Sold by
Frey Stephen and Frey Jennifer
Bought by
Millward Travis
Home Financials for this Owner
Home Financials are based on the most recent Mortgage that was taken out on this home.
Original Mortgage
$567,900
Interest Rate
3.58%
Mortgage Type
Construction
Purchase Details
Closed on
Jul 12, 2004
Sold by
Simmons Joseph Val and Simmons Kathleen W
Bought by
Frey Stephen and Frey Jennifer
Purchase Details
Closed on
Mar 3, 2003
Sold by
Cowania Llc
Bought by
Burns Susan Clark and Burns Brock W
Create a Home Valuation Report for This Property
The Home Valuation Report is an in-depth analysis detailing your home's value as well as a comparison with similar homes in the area
Home Values in the Area
Average Home Value in this Area
Purchase History
| Date | Buyer | Sale Price | Title Company |
|---|---|---|---|
| Millward Travis | -- | Amrock Inc | |
| Millward Travis | -- | Citadel Title & Escrow Llc | |
| Frey Stephen | -- | First American Title Agency | |
| Burns Susan Clark | -- | -- |
Source: Public Records
Mortgage History
| Date | Status | Borrower | Loan Amount |
|---|---|---|---|
| Open | Millward Travis | $510,000 | |
| Closed | Millward Travis | $567,900 |
Source: Public Records
Tax History Compared to Growth
Tax History
| Year | Tax Paid | Tax Assessment Tax Assessment Total Assessment is a certain percentage of the fair market value that is determined by local assessors to be the total taxable value of land and additions on the property. | Land | Improvement |
|---|---|---|---|---|
| 2025 | $4,357 | $513,535 | $309,000 | $624,700 |
| 2024 | $4,357 | $509,850 | $0 | $0 |
| 2023 | $4,215 | $535,590 | $0 | $0 |
| 2022 | $3,927 | $483,780 | $0 | $0 |
| 2021 | $3,557 | $662,500 | $178,800 | $483,700 |
| 2020 | $3,356 | $617,700 | $165,600 | $452,100 |
| 2019 | $3,000 | $574,100 | $165,600 | $408,500 |
| 2018 | $2,999 | $542,600 | $134,100 | $408,500 |
| 2017 | $2,713 | $260,920 | $0 | $0 |
| 2016 | $2,795 | $249,425 | $0 | $0 |
| 2015 | $2,343 | $198,495 | $0 | $0 |
| 2014 | $2,294 | $193,160 | $0 | $0 |
Source: Public Records
Map
Nearby Homes
- 6692 W 9770 N
- 9435 N Aspen Hollow Cir
- 9967 N 6670 W
- 975 E 2125 N
- 859 E 2125 N
- 9924 N 6630 W Unit 9
- 2208 N 825 E
- 1175 E 900 N
- 893 N 1580 E
- 3935 W 1000 N Unit 438
- 3983 W 1000 N Unit 442
- 4007 W 1000 N
- 3947 W 1000 N Unit 439
- 3959 W 1000 N
- 832 N Somerset Alley
- 735 N 1000 E
- 595 N 1200 E
- 901 N Lakota Rd
- 6399 W 10150 N
- 1438 N 400 W
- 1664 N 1400 E
- 1720 N 1400 E
- 1687 N 1400 E
- 1663 N 1400 E
- 1715 N 1400 E
- 1638 N 1400 E
- 1619 N 1400 E
- 1734 N 1400 E
- 1723 N 1400 E
- 1614 N 1400 E
- 1720 N 1200 E
- 9729 N 7000 W Unit 107
- 1731 N 1400 E
- 1596 N 1400 E
- 9757 N 7000 W
- 1593 N 1400 E
- 1798 N Cedar Hollow Dr
- 1798 N Cedar Hollow Dr
- 1737 N 1400 E
- 1763 N 1400 E