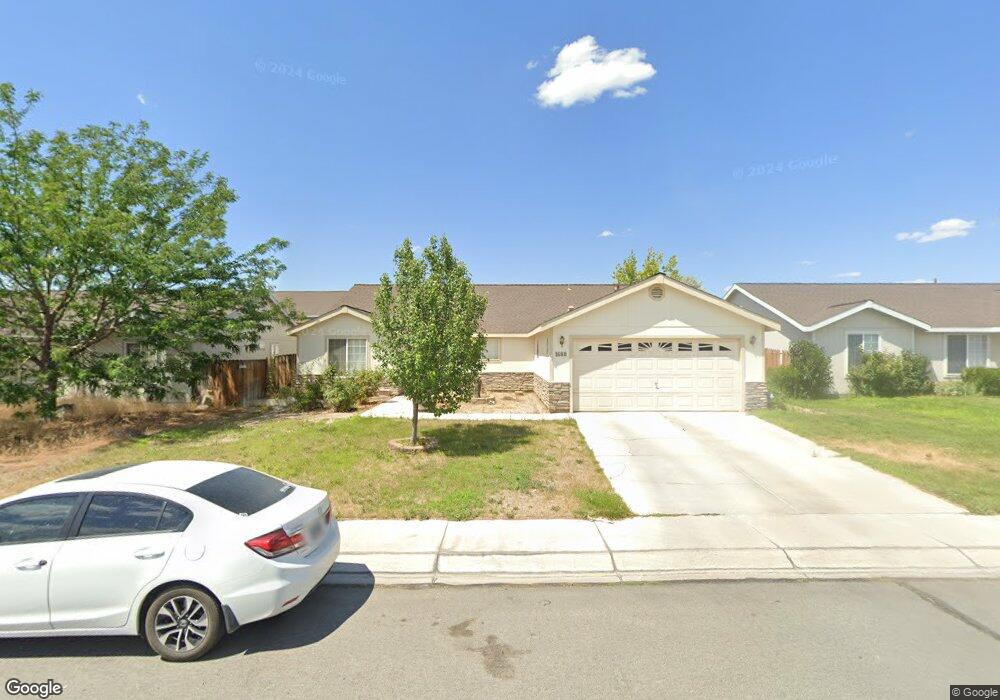
1688 Round up Rd Unit 3 Fernley, NV 89408
Estimated Value: $411,000 - $434,000
4
Beds
2
Baths
2,199
Sq Ft
$192/Sq Ft
Est. Value
About This Home
This home is located at 1688 Round up Rd Unit 3, Fernley, NV 89408 and is currently estimated at $421,604, approximately $191 per square foot. 1688 Round up Rd Unit 3 is a home located in Lyon County with nearby schools including East Valley Elementary School, Fernley Intermediate School, and Fernley High School.
Ownership History
Date
Name
Owned For
Owner Type
Purchase Details
Closed on
Nov 2, 2011
Sold by
The Bank Of New York Mellon
Bought by
Hosking Ellen C
Current Estimated Value
Home Financials for this Owner
Home Financials are based on the most recent Mortgage that was taken out on this home.
Original Mortgage
$76,800
Outstanding Balance
$52,547
Interest Rate
4.09%
Mortgage Type
New Conventional
Estimated Equity
$369,057
Purchase Details
Closed on
Jul 1, 2011
Sold by
Mosher David A and Mosher Rebecca L
Bought by
The Bank Of New York Mellon
Purchase Details
Closed on
Sep 29, 2005
Sold by
River Ranch Estates Llc
Bought by
Mosher David A and Mosher Rebecca L
Home Financials for this Owner
Home Financials are based on the most recent Mortgage that was taken out on this home.
Original Mortgage
$205,348
Interest Rate
5.7%
Mortgage Type
New Conventional
Create a Home Valuation Report for This Property
The Home Valuation Report is an in-depth analysis detailing your home's value as well as a comparison with similar homes in the area
Home Values in the Area
Average Home Value in this Area
Purchase History
| Date | Buyer | Sale Price | Title Company |
|---|---|---|---|
| Hosking Ellen C | $96,000 | Ticor Title Of Nevada | |
| The Bank Of New York Mellon | $211,182 | Accommodation | |
| Mosher David A | $256,685 | Title Service & Escrow |
Source: Public Records
Mortgage History
| Date | Status | Borrower | Loan Amount |
|---|---|---|---|
| Open | Hosking Ellen C | $76,800 | |
| Previous Owner | Mosher David A | $205,348 |
Source: Public Records
Tax History Compared to Growth
Tax History
| Year | Tax Paid | Tax Assessment Tax Assessment Total Assessment is a certain percentage of the fair market value that is determined by local assessors to be the total taxable value of land and additions on the property. | Land | Improvement |
|---|---|---|---|---|
| 2025 | $1,745 | $123,383 | $43,750 | $79,633 |
| 2024 | $2,104 | $123,816 | $43,750 | $80,066 |
| 2023 | $2,104 | $118,789 | $43,750 | $75,039 |
| 2022 | $1,976 | $113,650 | $43,750 | $69,900 |
| 2021 | $1,955 | $102,744 | $34,650 | $68,094 |
| 2020 | $1,905 | $99,199 | $34,650 | $64,549 |
| 2019 | $1,878 | $93,597 | $31,500 | $62,097 |
| 2018 | $1,839 | $81,595 | $21,000 | $60,595 |
| 2017 | $1,830 | $73,676 | $13,130 | $60,546 |
| 2016 | $1,639 | $58,213 | $5,780 | $52,433 |
| 2015 | $1,674 | $45,441 | $5,780 | $39,661 |
| 2014 | $1,636 | $34,393 | $5,780 | $28,613 |
Source: Public Records
Map
Nearby Homes
- 1687 Round up Rd
- 572 Spur Way
- 533 Dutch Oven Ct Unit 3
- 1844 Fort Sutter Blvd Unit Lot 5
- 1848 Fort Sutter Blvd Unit Lot 6
- 4521 Madison Rd
- 4520 Mifflin St Unit Lot 1
- 4520 Mifflin St
- 4531 Mifflin St Unit Lot 28
- 4531 Mifflin St
- Tahoe Plan at Nevada Sky
- Topaz Plan at Nevada Sky
- Washoe Plan at Nevada Sky
- 1525 Wrangler Ln
- 4535 Mifflin St
- 863 Jennys Ln
- 4536 Mifflin St Unit Lot 5
- 4536 Mifflin St
- 870 Jennys Ln
- 4547 Mifflin St Unit Lot 24
- 1686 Round up Rd Unit 2
- 1637 Meadows Ave
- 1639 Meadows Ave
- 1635 Meadows Ave
- 1684 Round up Rd
- 1692 Round up Rd Unit 3
- 1641 Meadows Ave
- 1633 Meadows Ave
- 1685 Round up Rd
- 1689 Round up Rd
- 1682 Round up Rd
- 1683 Round up Rd Unit 2
- 1691 Round up Rd
- 1631 Meadows Ave
- 1694 Round up Rd
- 1643 Meadows Ave
- 548 Brick Oven Ct
- 1693 Round up Rd
- 1696 Round up Rd
- 1680 Round up Rd Unit 2