16885 Rue du Parc Unit Lot 717 Reno, NV 89511
Montreux NeighborhoodEstimated Value: $2,192,951 - $2,576,000
4
Beds
5
Baths
3,785
Sq Ft
$631/Sq Ft
Est. Value
About This Home
This home is located at 16885 Rue du Parc Unit Lot 717, Reno, NV 89511 and is currently estimated at $2,387,738, approximately $630 per square foot. 16885 Rue du Parc Unit Lot 717 is a home located in Washoe County with nearby schools including Ted Hunsburger Elementary School, Marce Herz Middle School, and Galena High School.
Ownership History
Date
Name
Owned For
Owner Type
Purchase Details
Closed on
May 1, 2019
Sold by
Daoust Eugene Max and Daoust Joyce Anne
Bought by
Leone Roger and Leone Ricarda
Current Estimated Value
Home Financials for this Owner
Home Financials are based on the most recent Mortgage that was taken out on this home.
Original Mortgage
$1,078,400
Outstanding Balance
$944,261
Interest Rate
4%
Mortgage Type
New Conventional
Estimated Equity
$1,443,477
Purchase Details
Closed on
Jul 25, 2006
Sold by
Samuels Taylor and Samuels Britta
Bought by
Daoust Eugene Max and Daoust Joyce Anne
Purchase Details
Closed on
Aug 19, 2004
Sold by
Montreux Highlands Llc
Bought by
Samuels Taylor and Samuels Britta
Home Financials for this Owner
Home Financials are based on the most recent Mortgage that was taken out on this home.
Original Mortgage
$908,800
Interest Rate
5.95%
Mortgage Type
New Conventional
Create a Home Valuation Report for This Property
The Home Valuation Report is an in-depth analysis detailing your home's value as well as a comparison with similar homes in the area
Home Values in the Area
Average Home Value in this Area
Purchase History
| Date | Buyer | Sale Price | Title Company |
|---|---|---|---|
| Leone Roger | $1,348,000 | First Centennial Reno | |
| Daoust Eugene Max | $1,260,000 | Stewart Title Of Northern Nv | |
| Samuels Taylor | $1,136,000 | Ticor Title Of Nevada Inc |
Source: Public Records
Mortgage History
| Date | Status | Borrower | Loan Amount |
|---|---|---|---|
| Open | Leone Roger | $1,078,400 | |
| Previous Owner | Samuels Taylor | $908,800 |
Source: Public Records
Tax History Compared to Growth
Tax History
| Year | Tax Paid | Tax Assessment Tax Assessment Total Assessment is a certain percentage of the fair market value that is determined by local assessors to be the total taxable value of land and additions on the property. | Land | Improvement |
|---|---|---|---|---|
| 2025 | $8,951 | $462,038 | $131,250 | $330,788 |
| 2024 | $8,951 | $455,333 | $122,500 | $332,833 |
| 2023 | $8,700 | $432,511 | $113,750 | $318,761 |
| 2022 | $8,245 | $365,115 | $105,000 | $260,115 |
| 2021 | $8,016 | $357,071 | $98,000 | $259,071 |
| 2020 | $7,767 | $345,029 | $85,750 | $259,279 |
| 2019 | $7,691 | $322,225 | $68,250 | $253,975 |
| 2018 | $7,318 | $296,307 | $47,950 | $248,357 |
| 2017 | $7,007 | $282,461 | $46,410 | $236,051 |
| 2016 | $6,830 | $284,488 | $46,200 | $238,288 |
| 2015 | $6,815 | $271,624 | $43,960 | $227,664 |
| 2014 | $6,616 | $253,192 | $43,960 | $209,232 |
| 2013 | -- | $212,237 | $29,750 | $182,487 |
Source: Public Records
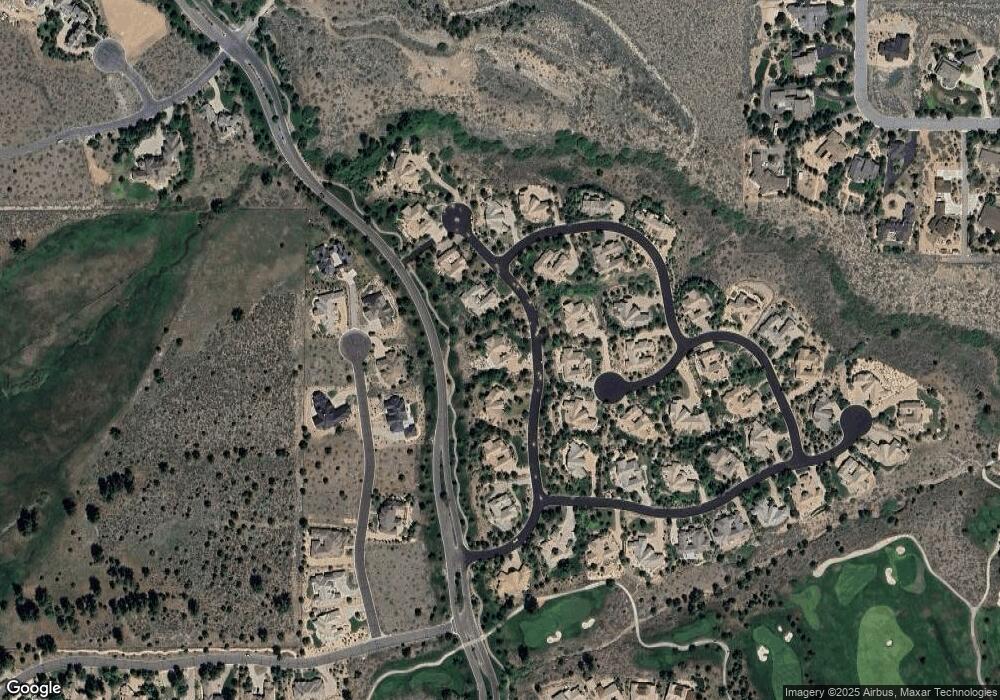
Map
Nearby Homes
- 16956 Rue du Parc
- 5685 Alpinista Cir
- 5715 Nordend Way
- 5550 Lausanne Dr
- 5605 Alpinista Cir
- 5945 Chambery Cir
- 6410 Zermatt Ct
- 6130 Lake Geneva Dr
- 6365 Wetzel Ct
- 16700 Mount Rose Hwy
- 6360 Wetzel Ct
- 6090 Lake Geneva Dr
- 6360 de Chardin Ln
- 5680 Lausanne Dr
- 6038 Breithorn Cir
- 6553 Champetre Ct
- 6140 Philoree Ln
- 6025 Lake Geneva Dr
- 48 Rose Creek Ln
- 5320 Nestle Ct
- 16885 Rue du Parc
- 16865 Rue du Parc
- 16800 Delacroix
- 16820 Delacroix
- 16825 Delacroix Unit 710
- 16825 Delacroix
- 6000 Gauguin Dr
- 16845 Rue du Parc
- 16956 Rue du Parc Unit 715
- 16880 Salut Ct
- 16900 Salut Ct Unit 818
- 16900 Salut Ct
- 16860 Salut Ct
- 16860 Salut Ct Unit 816
- 6005 Cartier Dr Unit 711
- 6005 Cartier Dr
- 5990 Gauguin Dr
- 5990 Gauguin Dr Unit 744
- 5980 Gauguin Dr
- 5980 Gauguin Dr Unit 745