Estimated Value: $166,000 - $194,879
3
Beds
1
Bath
1,421
Sq Ft
$127/Sq Ft
Est. Value
About This Home
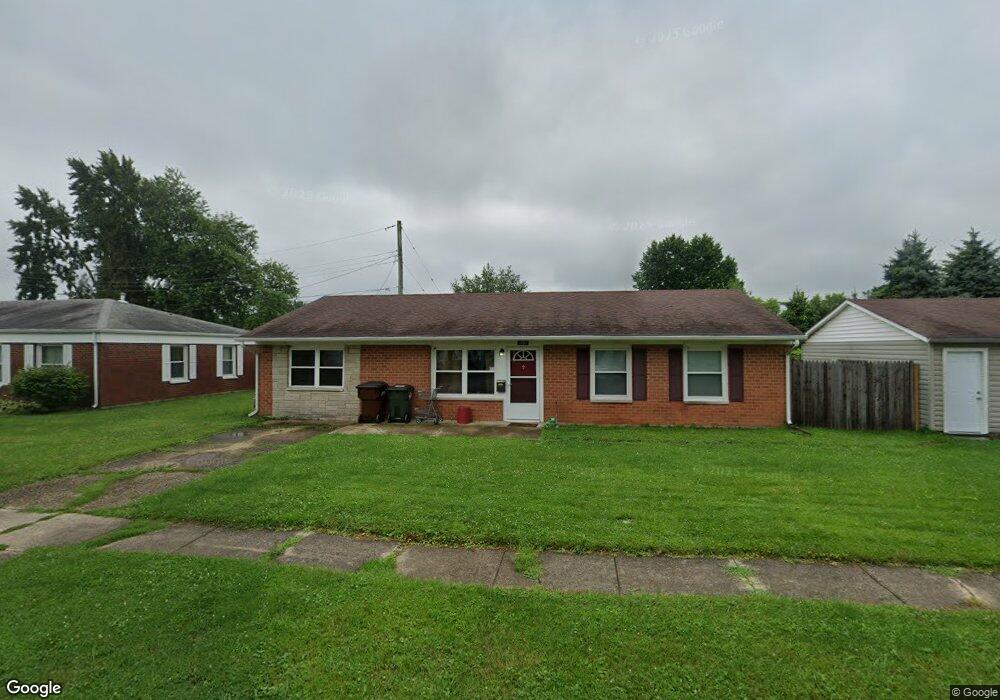
This home is located at 1689 Reid Ave, Xenia, OH 45385 and is currently estimated at $180,970, approximately $127 per square foot. 1689 Reid Ave is a home located in Greene County with nearby schools including Xenia High School, Summit Academy Community School for Alternative Learners - Xenia, and Legacy Christian Academy.
Ownership History
Date
Name
Owned For
Owner Type
Purchase Details
Closed on
Apr 3, 2019
Sold by
Osborne Dillon J
Bought by
Taylor Austin L
Current Estimated Value
Home Financials for this Owner
Home Financials are based on the most recent Mortgage that was taken out on this home.
Original Mortgage
$103,098
Outstanding Balance
$90,641
Interest Rate
4.3%
Mortgage Type
FHA
Estimated Equity
$90,329
Purchase Details
Closed on
Jan 6, 2015
Sold by
Osborne Renee L
Bought by
Osborne Dillon J
Purchase Details
Closed on
Dec 13, 2013
Sold by
Mustard Elaine K and Mitchell Elaine K
Bought by
Osborne Dillon J and Osborne Renee L
Home Financials for this Owner
Home Financials are based on the most recent Mortgage that was taken out on this home.
Original Mortgage
$77,569
Interest Rate
4.12%
Mortgage Type
FHA
Purchase Details
Closed on
Jul 23, 2009
Sold by
Mitchell Elaine K and Mustard Elaine K
Bought by
Mitchell Elaine K and Mustard Elaine K
Purchase Details
Closed on
Apr 20, 2009
Sold by
Mitchell Elaine K and Mustard Elaine K
Bought by
Mustard Blair R and Gardner Linda D
Create a Home Valuation Report for This Property
The Home Valuation Report is an in-depth analysis detailing your home's value as well as a comparison with similar homes in the area
Home Values in the Area
Average Home Value in this Area
Purchase History
| Date | Buyer | Sale Price | Title Company |
|---|---|---|---|
| Taylor Austin L | $105,000 | None Available | |
| Osborne Dillon J | -- | None Available | |
| Osborne Dillon J | $79,000 | None Available | |
| Mitchell Elaine K | -- | Attorney | |
| Mitchell Elaine K | -- | Attorney | |
| Mustard Blair R | -- | Attorney |
Source: Public Records
Mortgage History
| Date | Status | Borrower | Loan Amount |
|---|---|---|---|
| Open | Taylor Austin L | $103,098 | |
| Previous Owner | Osborne Dillon J | $77,569 |
Source: Public Records
Tax History Compared to Growth
Tax History
| Year | Tax Paid | Tax Assessment Tax Assessment Total Assessment is a certain percentage of the fair market value that is determined by local assessors to be the total taxable value of land and additions on the property. | Land | Improvement |
|---|---|---|---|---|
| 2024 | $2,170 | $50,710 | $10,420 | $40,290 |
| 2023 | $2,170 | $50,710 | $10,420 | $40,290 |
| 2022 | $1,790 | $35,680 | $7,440 | $28,240 |
| 2021 | $1,814 | $35,680 | $7,440 | $28,240 |
| 2020 | $1,738 | $35,680 | $7,440 | $28,240 |
| 2019 | $1,371 | $26,500 | $5,650 | $20,850 |
| 2018 | $1,377 | $26,500 | $5,650 | $20,850 |
| 2017 | $1,337 | $26,500 | $5,650 | $20,850 |
| 2016 | $1,303 | $24,620 | $5,650 | $18,970 |
| 2015 | $1,307 | $24,620 | $5,650 | $18,970 |
| 2014 | $1,251 | $24,620 | $5,650 | $18,970 |
Source: Public Records
Map
Nearby Homes
- 121 S Progress Dr
- 1391 June Dr
- 1283 June Dr
- 1342 Kylemore Dr
- 1351 Omard Dr
- 1233 June Dr
- 1223 June Dr
- 1568 Cheyenne Dr
- 1144 Rockwell Dr
- 343 Sheelin Rd
- 1618 Navajo Dr
- 161 Montana Dr
- 2758 Wyoming Dr
- 1653 Seneca Dr
- 912 Omard Dr
- 883 Omard Dr
- 509 Antrim Rd
- 219 Kansas Dr
- 1208 Bellbrook Ave
- 1272 Bellbrook Ave