Estimated Value: $122,000 - $183,147
3
Beds
2
Baths
960
Sq Ft
$169/Sq Ft
Est. Value
About This Home
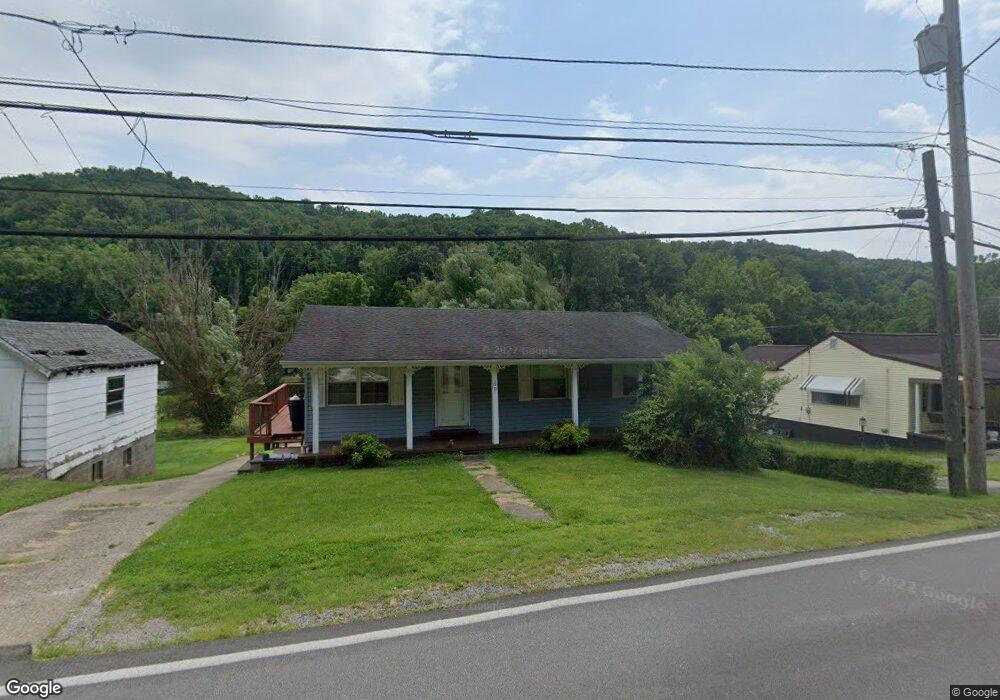
This home is located at 169 40th St Unit A, Nitro, WV 25143 and is currently estimated at $162,537, approximately $169 per square foot. 169 40th St Unit A is a home located in Kanawha County with nearby schools including Nitro Elementary School, Andrew Jackson Middle School, and Nitro High School.
Ownership History
Date
Name
Owned For
Owner Type
Purchase Details
Closed on
Nov 21, 2012
Sold by
Parsons Richard G
Bought by
Draham Adam T and Anderson Cynthia S
Current Estimated Value
Home Financials for this Owner
Home Financials are based on the most recent Mortgage that was taken out on this home.
Original Mortgage
$121,820
Outstanding Balance
$84,158
Interest Rate
3.46%
Mortgage Type
FHA
Estimated Equity
$78,379
Purchase Details
Closed on
Jul 28, 2009
Sold by
Clark Homer L
Bought by
Parsons Richard G
Home Financials for this Owner
Home Financials are based on the most recent Mortgage that was taken out on this home.
Original Mortgage
$84,600
Interest Rate
5.58%
Mortgage Type
New Conventional
Purchase Details
Closed on
Jan 31, 2003
Sold by
Casto John
Bought by
Clark Homer
Home Financials for this Owner
Home Financials are based on the most recent Mortgage that was taken out on this home.
Original Mortgage
$97,920
Interest Rate
6.09%
Mortgage Type
VA
Create a Home Valuation Report for This Property
The Home Valuation Report is an in-depth analysis detailing your home's value as well as a comparison with similar homes in the area
Home Values in the Area
Average Home Value in this Area
Purchase History
| Date | Buyer | Sale Price | Title Company |
|---|---|---|---|
| Draham Adam T | $125,000 | -- | |
| Parsons Richard G | $94,000 | -- | |
| Clark Homer | $96,000 | -- |
Source: Public Records
Mortgage History
| Date | Status | Borrower | Loan Amount |
|---|---|---|---|
| Open | Draham Adam T | $121,820 | |
| Previous Owner | Parsons Richard G | $84,600 | |
| Previous Owner | Clark Homer | $97,920 |
Source: Public Records
Tax History
| Year | Tax Paid | Tax Assessment Tax Assessment Total Assessment is a certain percentage of the fair market value that is determined by local assessors to be the total taxable value of land and additions on the property. | Land | Improvement |
|---|---|---|---|---|
| 2025 | $972 | $61,440 | $6,180 | $55,260 |
| 2024 | $972 | $62,100 | $6,180 | $55,920 |
| 2023 | $983 | $62,100 | $6,180 | $55,920 |
| 2022 | $999 | $63,060 | $6,180 | $56,880 |
| 2021 | $895 | $56,340 | $6,180 | $50,160 |
| 2020 | $896 | $56,340 | $6,180 | $50,160 |
| 2019 | $905 | $56,940 | $6,180 | $50,760 |
| 2018 | $826 | $57,540 | $6,180 | $51,360 |
| 2017 | $836 | $58,440 | $6,180 | $52,260 |
| 2016 | $842 | $58,980 | $6,180 | $52,800 |
| 2015 | $839 | $58,980 | $6,180 | $52,800 |
| 2014 | $821 | $58,800 | $6,180 | $52,620 |
Source: Public Records
Map
Nearby Homes
Your Personal Tour Guide
Ask me questions while you tour the home.