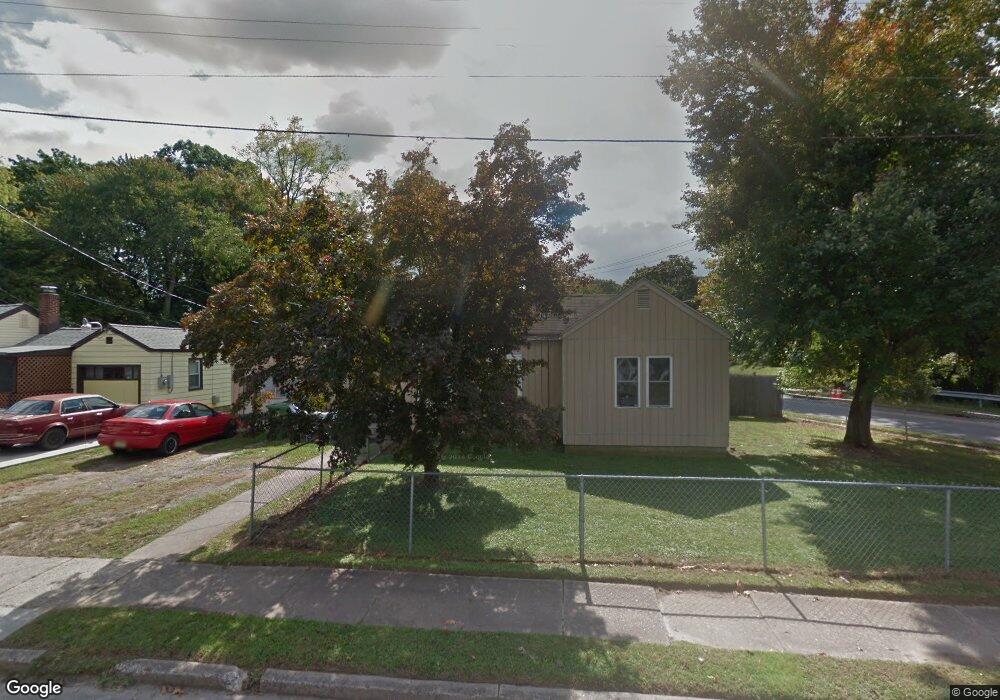
169 Alcyon Blvd Pitman, NJ 08071
Estimated Value: $245,194 - $351,000
Studio
--
Bath
1,172
Sq Ft
$259/Sq Ft
Est. Value
About This Home
This home is located at 169 Alcyon Blvd, Pitman, NJ 08071 and is currently estimated at $303,549, approximately $259 per square foot. 169 Alcyon Blvd is a home located in Gloucester County with nearby schools including W.C.K. Walls Elementary School, Pitman Middle School, and Pitman High School.
Ownership History
Date
Name
Owned For
Owner Type
Purchase Details
Closed on
Jun 30, 2006
Sold by
Mourning Ellen M
Bought by
David Vollmer
Current Estimated Value
Home Financials for this Owner
Home Financials are based on the most recent Mortgage that was taken out on this home.
Original Mortgage
$118,755
Outstanding Balance
$70,307
Interest Rate
6.6%
Mortgage Type
Purchase Money Mortgage
Estimated Equity
$233,242
Create a Home Valuation Report for This Property
The Home Valuation Report is an in-depth analysis detailing your home's value as well as a comparison with similar homes in the area
Home Values in the Area
Average Home Value in this Area
Purchase History
| Date | Buyer | Sale Price | Title Company |
|---|---|---|---|
| David Vollmer | $130,000 | -- |
Source: Public Records
Mortgage History
| Date | Status | Borrower | Loan Amount |
|---|---|---|---|
| Open | David Vollmer | $118,755 |
Source: Public Records
Tax History
| Year | Tax Paid | Tax Assessment Tax Assessment Total Assessment is a certain percentage of the fair market value that is determined by local assessors to be the total taxable value of land and additions on the property. | Land | Improvement |
|---|---|---|---|---|
| 2025 | $5,868 | $168,000 | $52,800 | $115,200 |
| 2024 | $5,714 | $168,000 | $52,800 | $115,200 |
| 2023 | $5,714 | $168,000 | $52,800 | $115,200 |
| 2022 | $5,489 | $168,000 | $52,800 | $115,200 |
| 2021 | $5,105 | $119,400 | $45,800 | $73,600 |
| 2020 | $5,289 | $119,400 | $45,800 | $73,600 |
| 2019 | $5,165 | $119,400 | $45,800 | $73,600 |
| 2018 | $5,078 | $119,400 | $45,800 | $73,600 |
| 2017 | $5,015 | $119,400 | $45,800 | $73,600 |
| 2016 | $4,918 | $119,400 | $45,800 | $73,600 |
| 2015 | $4,786 | $119,400 | $45,800 | $73,600 |
| 2014 | $4,639 | $119,400 | $45,800 | $73,600 |
Source: Public Records
Map
Nearby Homes
- 1300 Cedar Ave
- 407 Tuohy Ave
- 349 W Jersey Ave
- 198 West Ave
- 135 Laurel Ave
- 1040 N Main St
- 142 2nd Ave
- 740 Carpenter St
- 205 Adams Ave
- 14 4th Ave
- 127 W Holly Ave
- 315 Lake Ave
- 237 Adams Ave
- 344 Columbia Ave
- 302 Montgomery Ave
- 508 Hudson Ave
- 49 Winterberry Ct
- 64 Yellowwood Ct Unit 64
- 103 N Brentwood Ave
- 603 Hudson Ave
- 165 Alcyon Blvd
- 161 Alcyon Blvd
- 1302 Cedar Ave
- 1013 Cedar Ave
- 925 Cedar Ave
- 826 Long Ave
- 157 Alcyon Blvd
- 822 Long Ave
- 926 Cedar Ave
- 1017 Cedar Ave
- 919 Cedar Ave
- 820 Long Ave
- 160 Brookfield Ave
- 1303 Stafford Rd
- 153 Alcyon Blvd
- 924 Cedar Ave
- 1 N Cummings Ave
- 1025 Cedar Ave
- 835 Long Ave
- 156 Brookfield Ave
Your Personal Tour Guide
Ask me questions while you tour the home.