169 Amhurst Cir West Point, GA 31833
Estimated Value: $295,000 - $321,000
4
Beds
3
Baths
1,904
Sq Ft
$161/Sq Ft
Est. Value
About This Home
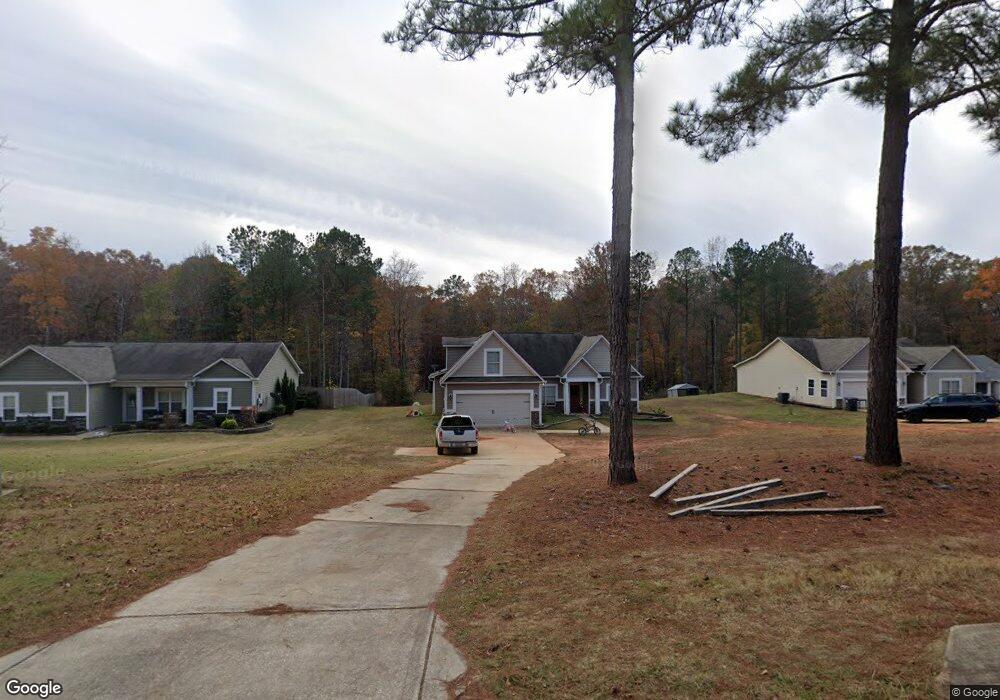
This home is located at 169 Amhurst Cir, West Point, GA 31833 and is currently estimated at $306,276, approximately $160 per square foot. 169 Amhurst Cir is a home located in Troup County with nearby schools including West Point Elementary School, Long Cane Elementary School, and Whitesville Road Elementary School.
Ownership History
Date
Name
Owned For
Owner Type
Purchase Details
Closed on
Aug 25, 2021
Sold by
Altemari Katelyn Dorothy
Bought by
Greathouse Sarah Annelle and Greathouse Mackenzie
Current Estimated Value
Home Financials for this Owner
Home Financials are based on the most recent Mortgage that was taken out on this home.
Original Mortgage
$227,797
Outstanding Balance
$205,918
Interest Rate
2.8%
Mortgage Type
FHA
Estimated Equity
$100,358
Purchase Details
Closed on
Aug 22, 2018
Sold by
Torrance Ashley L
Bought by
Altemari Katelyn Dorothy
Home Financials for this Owner
Home Financials are based on the most recent Mortgage that was taken out on this home.
Original Mortgage
$183,838
Interest Rate
4.5%
Mortgage Type
New Conventional
Purchase Details
Closed on
Mar 23, 2017
Bought by
Torrance Ashley L and Shaw Justin A
Home Financials for this Owner
Home Financials are based on the most recent Mortgage that was taken out on this home.
Original Mortgage
$174,284
Interest Rate
4.16%
Mortgage Type
FHA
Create a Home Valuation Report for This Property
The Home Valuation Report is an in-depth analysis detailing your home's value as well as a comparison with similar homes in the area
Home Values in the Area
Average Home Value in this Area
Purchase History
| Date | Buyer | Sale Price | Title Company |
|---|---|---|---|
| Greathouse Sarah Annelle | $233,500 | -- | |
| Altemari Katelyn Dorothy | $182,000 | -- | |
| Torrance Ashley L | $177,500 | -- |
Source: Public Records
Mortgage History
| Date | Status | Borrower | Loan Amount |
|---|---|---|---|
| Open | Greathouse Sarah Annelle | $227,797 | |
| Previous Owner | Altemari Katelyn Dorothy | $183,838 | |
| Previous Owner | Torrance Ashley L | $174,284 |
Source: Public Records
Tax History
| Year | Tax Paid | Tax Assessment Tax Assessment Total Assessment is a certain percentage of the fair market value that is determined by local assessors to be the total taxable value of land and additions on the property. | Land | Improvement |
|---|---|---|---|---|
| 2025 | $3,261 | $119,560 | $14,000 | $105,560 |
| 2024 | $2,816 | $103,240 | $14,000 | $89,240 |
| 2023 | $2,737 | $100,360 | $14,000 | $86,360 |
| 2022 | $2,459 | $88,120 | $10,000 | $78,120 |
| 2021 | $2,278 | $75,520 | $10,000 | $65,520 |
| 2020 | $2,217 | $73,520 | $8,000 | $65,520 |
| 2019 | $2,103 | $69,720 | $6,000 | $63,720 |
| 2018 | $2,103 | $69,720 | $6,000 | $63,720 |
| 2017 | $2,103 | $69,720 | $6,000 | $63,720 |
| 2016 | $163 | $5,400 | $5,400 | $0 |
| 2015 | $163 | $5,400 | $5,400 | $0 |
| 2014 | $163 | $5,400 | $5,400 | $0 |
| 2013 | -- | $5,400 | $5,400 | $0 |
Source: Public Records
Map
Nearby Homes
- 107 Amhurst Dr
- 145 Jarrell Hogg Rd
- 101 Garden Walk
- 101 Garden Walk Unit 85
- 648 Warner Rd
- 0 Warner Rd Unit 10686116
- 182 Lower Lovelace Rd
- 225 Harris Walk
- 211 Harris Walk
- 223 Harris Walk
- 209 Harris Walk
- 221 Harris Walk
- 215 Harris Walk
- 0 Sandtown Rd Unit 10255987
- Sandtown Road Unit: 1 2+ - Acre
- 143 W Drummond Rd
- 151 W Drummond Rd
- 157 W Drummond Rd
- 137 W Drummond Rd
- 131 W Drummond Rd
- 169 Amhurst Cir Unit LOT 37
- 167 Amhurst Cir Unit LOT 36
- 167 Amhurst Cir
- 171 Amhurst Cir Unit LOT 38
- 171 Amhurst Cir
- 165 Amhurst Cir
- 173 Amhurst Cir Unit LOT 39
- 173 Amhurst Cir
- 178 Amhurst Cir Unit 72
- 163 Amhurst Cir Unit LOT 34
- 163 Amhurst Cir
- 166 Amhurst Cir
- 161 Amhurst Cir Unit LOT 33
- 161 Amhurst Cir
- 152 Amhurst Cir
- 177 Amhurst Cir Unit LOT 41
- 177 Amhurst Cir
- 180 Amhurst Cir Unit 73
- 192 Amhurst Cir
- 179 Amhurst Cir Unit LOT 42
Your Personal Tour Guide
Ask me questions while you tour the home.