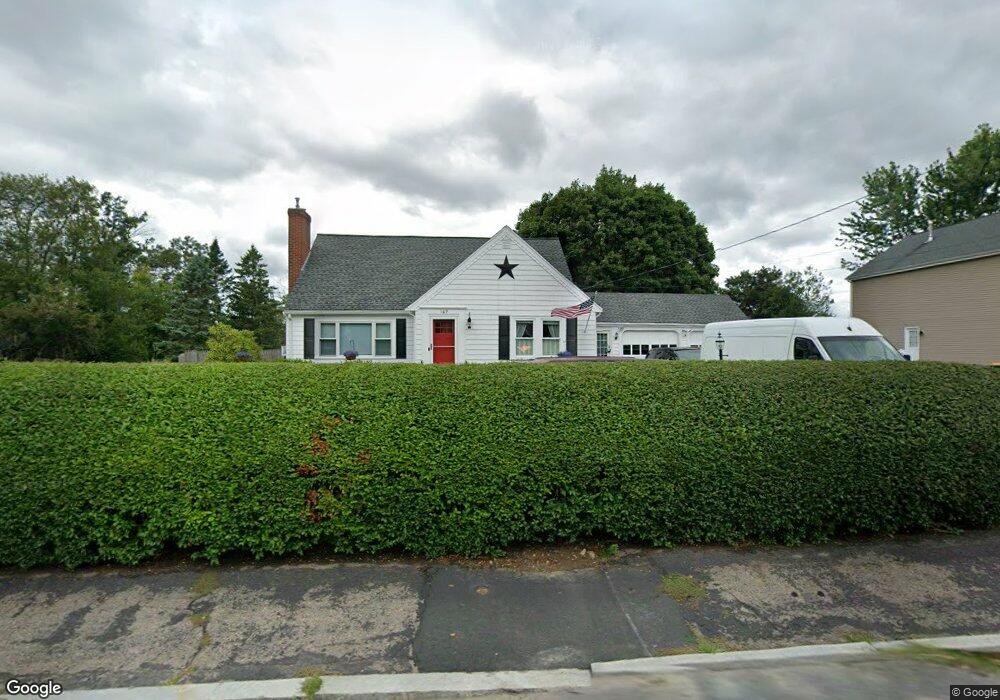
169 Arnold Rd North Attleboro, MA 02760
Estimated Value: $515,000 - $605,000
About This Home
This home is located at 169 Arnold Rd, North Attleboro, MA 02760 and is currently estimated at $560,628, approximately $323 per square foot. 169 Arnold Rd is a home located in Bristol County with nearby schools including North Attleboro High School and Discovery Daycare Center.
Ownership History
We collect this data history from publicly available records. To have your information removed, we recommend requesting removal directly through your county’s website.
Purchase Details
Home Financials for this Owner
Home Financials are based on the most recent Mortgage that was taken out on this home.Home Values in the Area
Average Home Value in this Area
Purchase History
We collect this data history from publicly available records. To have your information removed, we recommend requesting removal directly through your county’s website.
| Date | Buyer | Sale Price | Title Company |
|---|---|---|---|
| $365,000 | -- |
Mortgage History
We collect this data history from publicly available records. To have your information removed, we recommend requesting removal directly through your county’s website.
| Date | Status | Borrower | Loan Amount |
|---|---|---|---|
| Open | $215,000 |
Tax History
We collect this data history from publicly available records. To have your information removed, we recommend requesting removal directly through your county’s website.
| Year | Tax Paid | Tax Assessment Tax Assessment Total Assessment is a certain percentage of the fair market value that is determined by local assessors to be the total taxable value of land and additions on the property. | Land | Improvement |
|---|---|---|---|---|
| 2025 | $6,079 | $515,600 | $162,900 | $352,700 |
| 2024 | $5,785 | $501,300 | $162,900 | $338,400 |
| 2023 | $5,904 | $461,600 | $162,900 | $298,700 |
| 2022 | $5,558 | $399,000 | $162,900 | $236,100 |
| 2021 | $5,156 | $361,300 | $162,900 | $198,400 |
| 2020 | $5,045 | $351,600 | $162,900 | $188,700 |
| 2019 | $4,796 | $336,800 | $148,100 | $188,700 |
| 2018 | $4,299 | $322,300 | $148,100 | $174,200 |
| 2017 | $4,027 | $304,600 | $148,100 | $156,500 |
| 2016 | $4,162 | $314,800 | $164,700 | $150,100 |
| 2015 | $3,862 | $293,900 | $164,700 | $129,200 |
| 2014 | $3,581 | $270,500 | $144,500 | $126,000 |
Map
- 18 Sunset Ave
- 32 Johnson St
- 58 Johnson St
- 11 Roland Baxter Rd
- 42 Caspian Way
- 25 Sumner St
- 157 Westside Ave
- 299 Broadway
- 117 Church St Unit 4
- 112 High St Unit B
- 80 Broadway Unit 59
- 108 Bayberry Rd
- 62 Ash St
- 28 Church St
- 34 High St
- 14 Broad St
- 202 S Washington St
- 139 East St
- 111 Anawan Rd
- 29 Fisher St
Ask me questions while you tour the home.