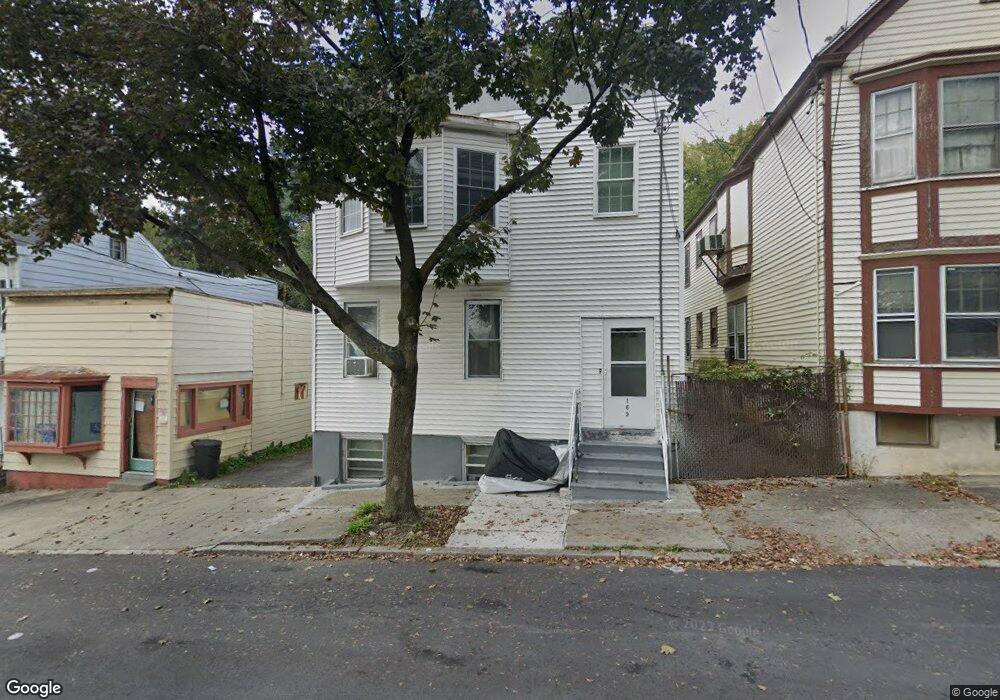
169 Broad St Albany, NY 12202
Estimated Value: $193,000 - $279,000
5
Beds
2
Baths
2,320
Sq Ft
$97/Sq Ft
Est. Value
About This Home
This home is located at 169 Broad St, Albany, NY 12202 and is currently estimated at $224,464, approximately $96 per square foot. 169 Broad St is a home located in Albany County with nearby schools including Giffen Memorial Elementary School, Stephen And Harriet Myers Middle School, and Albany High School.
Ownership History
Date
Name
Owned For
Owner Type
Purchase Details
Closed on
Jul 9, 2019
Sold by
Connor Pamela J O
Bought by
Jackson Justin
Current Estimated Value
Purchase Details
Closed on
Dec 31, 2008
Sold by
The County Of Albany New York
Bought by
Oconnor Pamela J
Purchase Details
Closed on
Jun 8, 2006
Sold by
Federian National Mortgag E Assoc
Bought by
Schultz Ogden
Purchase Details
Closed on
Jan 9, 2002
Sold by
Prince Jeanette
Bought by
Capital Dist Property Inv Estors Inc
Purchase Details
Closed on
Oct 3, 2001
Sold by
Big Vision General Contra Ctors Inc
Bought by
Prince Jeanette
Purchase Details
Closed on
Sep 28, 2001
Sold by
Tru Manufacturers and Tru Traders
Bought by
Big Vision General Cont
Purchase Details
Closed on
May 10, 2001
Create a Home Valuation Report for This Property
The Home Valuation Report is an in-depth analysis detailing your home's value as well as a comparison with similar homes in the area
Purchase History
| Date | Buyer | Sale Price | Title Company |
|---|---|---|---|
| Jackson Justin | $7,900 | None Available | |
| Oconnor Pamela J | $2,000 | None Available | |
| Schultz Ogden | $14,000 | -- | |
| Schultz Odgen | $14,000 | None Available | |
| Capital Dist Property Inv Estors Inc | -- | -- | |
| Prince Jeanette | -- | -- | |
| Big Vision General Cont | $7,000 | -- | |
| -- | $13,500 | -- |
Source: Public Records
Tax History
| Year | Tax Paid | Tax Assessment Tax Assessment Total Assessment is a certain percentage of the fair market value that is determined by local assessors to be the total taxable value of land and additions on the property. | Land | Improvement |
|---|---|---|---|---|
| 2024 | $4,917 | $171,000 | $34,200 | $136,800 |
| 2023 | $3,728 | $90,000 | $23,600 | $66,400 |
| 2022 | $4,353 | $90,000 | $23,600 | $66,400 |
| 2021 | $4,345 | $90,000 | $23,600 | $66,400 |
| 2020 | $3,581 | $90,000 | $23,600 | $66,400 |
| 2019 | $3,878 | $90,000 | $23,600 | $66,400 |
| 2018 | $3,805 | $90,000 | $23,600 | $66,400 |
| 2017 | $2,013 | $90,000 | $23,600 | $66,400 |
| 2016 | $3,727 | $90,000 | $23,600 | $66,400 |
| 2015 | $2,616 | $117,600 | $23,500 | $94,100 |
| 2014 | -- | $117,600 | $23,500 | $94,100 |
Source: Public Records
Map
Nearby Homes
Your Personal Tour Guide
Ask me questions while you tour the home.