Estimated Value: $445,000 - $548,000
--
Bed
--
Bath
2,428
Sq Ft
$205/Sq Ft
Est. Value
About This Home
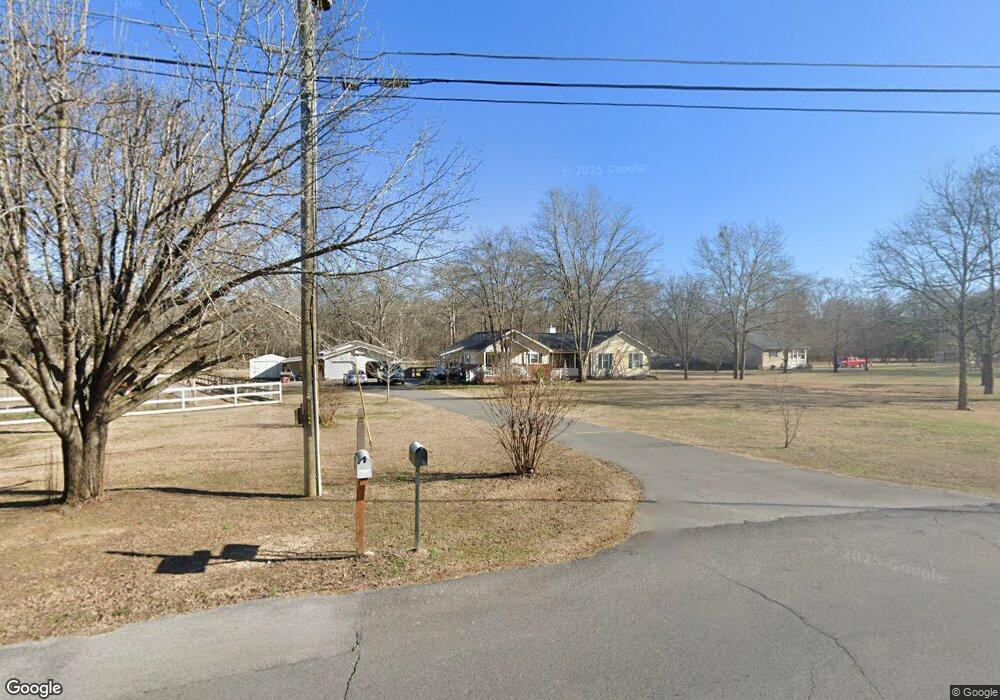
This home is located at 169 Canard Rd SE, Rome, GA 30161 and is currently estimated at $498,442, approximately $205 per square foot. 169 Canard Rd SE is a home located in Floyd County with nearby schools including Model Middle School and Model High School.
Ownership History
Date
Name
Owned For
Owner Type
Purchase Details
Closed on
Mar 16, 2021
Sold by
Singh Chaitram
Bought by
Worthington Billy J and Worthington Jennifer Michelle
Current Estimated Value
Home Financials for this Owner
Home Financials are based on the most recent Mortgage that was taken out on this home.
Original Mortgage
$275,808
Outstanding Balance
$247,659
Interest Rate
2.8%
Mortgage Type
VA
Estimated Equity
$250,783
Purchase Details
Closed on
Apr 19, 2002
Sold by
Thacker John L and Thacker Betty C
Bought by
Singh Chaitram
Purchase Details
Closed on
Aug 19, 1985
Bought by
P and R
Purchase Details
Closed on
Feb 6, 1984
Sold by
Hamler Bruce
Bought by
Thacker John L and Thacker Betty C
Purchase Details
Closed on
Sep 15, 1974
Sold by
Floyd Laurie Todd
Bought by
Hamler Bruce
Purchase Details
Closed on
Jan 1, 1901
Bought by
Floyd Laurie Todd
Create a Home Valuation Report for This Property
The Home Valuation Report is an in-depth analysis detailing your home's value as well as a comparison with similar homes in the area
Home Values in the Area
Average Home Value in this Area
Purchase History
| Date | Buyer | Sale Price | Title Company |
|---|---|---|---|
| Worthington Billy J | $340,000 | -- | |
| Singh Chaitram | $175,000 | -- | |
| P | -- | -- | |
| Thacker John L | $39,500 | -- | |
| Hamler Bruce | $17,900 | -- | |
| Floyd Laurie Todd | -- | -- |
Source: Public Records
Mortgage History
| Date | Status | Borrower | Loan Amount |
|---|---|---|---|
| Open | Worthington Billy J | $275,808 |
Source: Public Records
Tax History Compared to Growth
Tax History
| Year | Tax Paid | Tax Assessment Tax Assessment Total Assessment is a certain percentage of the fair market value that is determined by local assessors to be the total taxable value of land and additions on the property. | Land | Improvement |
|---|---|---|---|---|
| 2024 | $4,911 | $184,596 | $21,648 | $162,948 |
| 2023 | $3,941 | $158,625 | $19,680 | $138,945 |
| 2022 | $3,999 | $134,769 | $16,224 | $118,545 |
| 2021 | $1,614 | $93,005 | $14,741 | $78,264 |
| 2020 | $1,423 | $81,872 | $12,818 | $69,054 |
| 2019 | $1,355 | $79,230 | $12,818 | $66,412 |
| 2018 | $1,394 | $79,151 | $12,208 | $66,943 |
| 2017 | $1,357 | $76,900 | $11,304 | $65,596 |
| 2016 | $750 | $51,621 | $11,280 | $40,341 |
| 2015 | $1,387 | $51,621 | $11,280 | $40,341 |
| 2014 | $1,387 | $51,621 | $11,280 | $40,341 |
Source: Public Records
Map
Nearby Homes
- 21 Everwood Ct SE
- 30 Mountain Creek Dr SE
- 0 Fallen Branch Cir SE Unit 7397536
- 0 Fallen Branch Cir SE Unit 10311756
- 0 Fallen Branch Cir SE Unit 7234792
- 0 Fallen Branch Cir SE Unit 10172755
- 16 Fallen Branch Cir SE
- 1 Outpost Trail SE
- 3 Outpost Trail SE
- 0 Mountain Creek Dr SE Unit 10436191
- 0 N Quarters Dr Unit 7467468
- 0 N Quarters Dr Unit 37 10390869
- 158 Sproull Rd SE
- 7 Trimble Way SE
- 406 Fred Kelly Rd NE
- 139 Shoals Ferry Rd SE
- 45 Wildflower Rd NE
- 567 Fred Kelley Rd NE
- 127 Branson Rd SE
- 818 Morrison Camp Ground Rd NE
- 169 Canard Rd SE
- 185 Canard Rd SE
- 164 Canard Rd SE
- 195 Canard Rd SE
- 145 Canard Rd SE
- 150 Canard Rd SE
- 150 Canard Rd SE
- 210 Canard Rd SE
- 129 Canard Rd SE
- 215 Canard Rd SE
- 234 Canard Rd SE
- 120 Canard Rd SE
- 120 Canard Rd SE
- 120 Canard Rd SE
- 109 Canard Rd SE
- 303 Canard Rd SE
- 89 Canard Rd SE
- 0 Canard Rd SE Unit 7432130
- 0 Canard Rd SE Unit 7400646
- 0 Canard Rd SE Unit 3233258