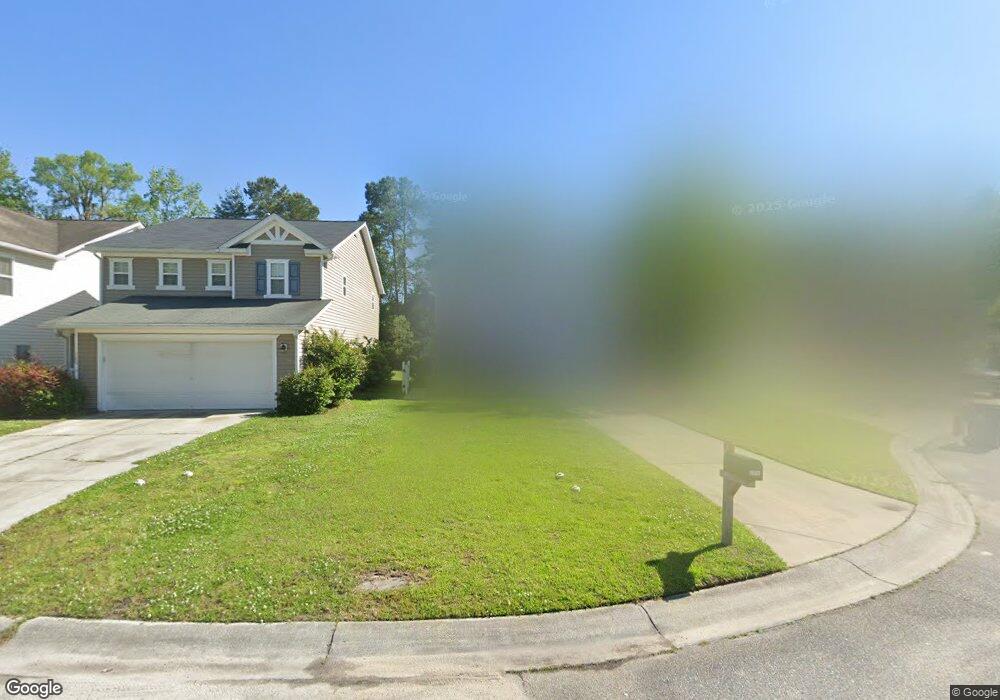
169 Chemistry Cir Ladson, SC 29456
Estimated Value: $329,000 - $332,000
3
Beds
3
Baths
1,581
Sq Ft
$209/Sq Ft
Est. Value
About This Home
This home is located at 169 Chemistry Cir, Ladson, SC 29456 and is currently estimated at $330,109, approximately $208 per square foot. 169 Chemistry Cir is a home located in Dorchester County with nearby schools including Oakbrook Elementary School, Oakbrook Middle School, and Fort Dorchester High School.
Ownership History
Date
Name
Owned For
Owner Type
Purchase Details
Closed on
Sep 30, 2008
Sold by
Abercrombie Aaron T and Abercrombie Ivy M
Bought by
Baker Matthew and Baker Deborah
Current Estimated Value
Home Financials for this Owner
Home Financials are based on the most recent Mortgage that was taken out on this home.
Original Mortgage
$168,547
Interest Rate
6.36%
Mortgage Type
VA
Purchase Details
Closed on
Aug 21, 2006
Sold by
Kb Home South Carolina Llc
Bought by
Abercrombie Aaron T and Abercrombie Ivy M
Home Financials for this Owner
Home Financials are based on the most recent Mortgage that was taken out on this home.
Original Mortgage
$127,744
Interest Rate
7.5%
Mortgage Type
Purchase Money Mortgage
Purchase Details
Closed on
Aug 17, 2005
Sold by
Scott Free Llc
Bought by
Kb Home South Carolina Llc
Purchase Details
Closed on
May 12, 2005
Sold by
Scott Free Llc
Bought by
Kb Home South Carolina Llc
Create a Home Valuation Report for This Property
The Home Valuation Report is an in-depth analysis detailing your home's value as well as a comparison with similar homes in the area
Home Values in the Area
Average Home Value in this Area
Purchase History
| Date | Buyer | Sale Price | Title Company |
|---|---|---|---|
| Baker Matthew | $165,000 | -- | |
| Abercrombie Aaron T | $159,680 | None Available | |
| Kb Home South Carolina Llc | $417,263 | -- | |
| Kb Home South Carolina Llc | $309,849 | -- |
Source: Public Records
Mortgage History
| Date | Status | Borrower | Loan Amount |
|---|---|---|---|
| Previous Owner | Baker Matthew | $168,547 | |
| Previous Owner | Abercrombie Aaron T | $127,744 |
Source: Public Records
Tax History Compared to Growth
Tax History
| Year | Tax Paid | Tax Assessment Tax Assessment Total Assessment is a certain percentage of the fair market value that is determined by local assessors to be the total taxable value of land and additions on the property. | Land | Improvement |
|---|---|---|---|---|
| 2025 | $1,390 | $13,668 | $4,560 | $9,108 |
| 2024 | $1,390 | $13,668 | $4,560 | $9,108 |
| 2023 | $1,390 | $6,628 | $2,000 | $4,628 |
| 2022 | $1,244 | $6,540 | $1,610 | $4,930 |
| 2021 | $1,244 | $6,540 | $1,610 | $4,930 |
| 2020 | $1,147 | $5,690 | $1,400 | $4,290 |
| 2019 | $1,111 | $5,690 | $1,400 | $4,290 |
| 2018 | $980 | $5,690 | $1,400 | $4,290 |
| 2017 | $974 | $5,690 | $1,400 | $4,290 |
| 2016 | $965 | $5,690 | $1,400 | $4,290 |
| 2015 | $961 | $5,690 | $1,400 | $4,290 |
| 2014 | $1,040 | $160,000 | $0 | $0 |
| 2013 | -- | $6,400 | $0 | $0 |
Source: Public Records
Map
Nearby Homes
- 193 Chemistry Cir
- 124 Diploma Dr
- 701 Professor Dr
- 419 Equinox Cir
- 206 Equinox Cir
- 203 Ibis Dr
- 201 Ibis Dr
- 154 Grand Oaks Dr Unit 4102
- 174 Education Blvd
- 209 Grand Oaks Dr Unit 2102
- 4504 Winterwood Place
- 203 Oakmont Ave Unit B
- 229 Grand Oaks Dr
- 108 Spanish Oaks Ln Unit 4703
- 9752 Transplanter Cir
- 117 Spanish Oaks Ln
- 3921 Ladson Rd
- 9512 Raven Dr
- 9612 Blue Jay Ct
- 9101 Parlor Dr
- 165 Chemistry Cir
- 173 Chemistry Cir
- 161 Chemistry Cir
- 177 Chemistry Cir
- 157 Chemistry Cir
- 186 Chemistry Cir
- 181 Chemistry Cir
- 185 Chemistry Cir
- 153 Chemistry Cir
- 190 Chemistry Cir
- 189 Chemistry Cir
- 160 Chemistry Cir
- 102 Graduate Ln
- 104 Graduate Ln
- 194 Chemistry Cir
- 149 Chemistry Cir
- 156 Chemistry Cir
- 197 Chemistry Cir
- 106 Graduate Ln
- 198 Chemistry Cir