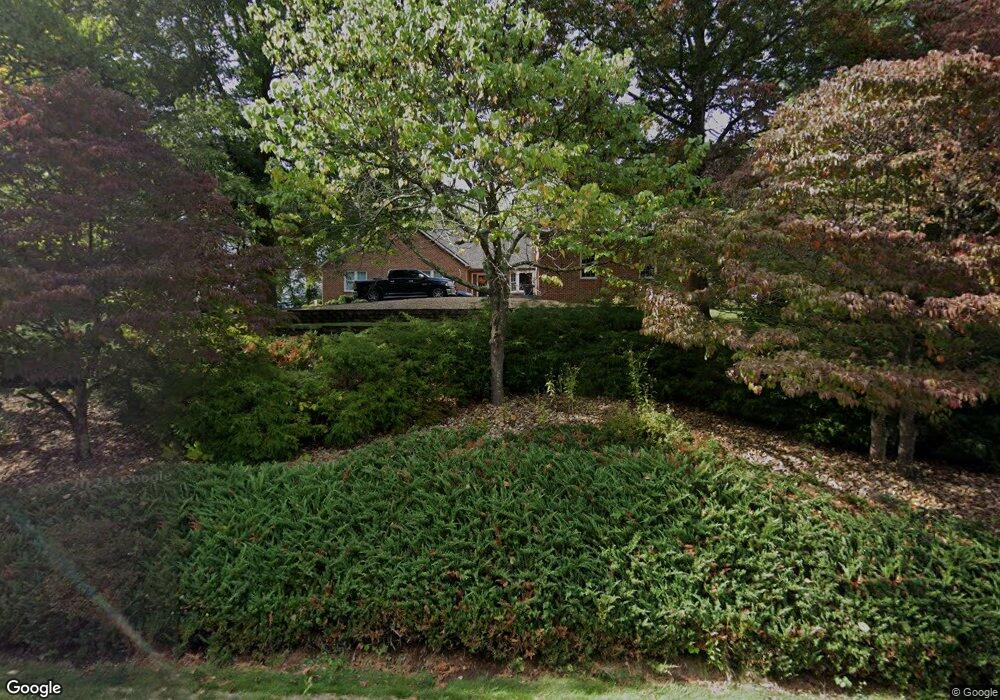
169 Cranberry Dr Stuarts Draft, VA 24477
Estimated Value: $474,000 - $543,000
4
Beds
3
Baths
2,505
Sq Ft
$204/Sq Ft
Est. Value
About This Home
This home is located at 169 Cranberry Dr, Stuarts Draft, VA 24477 and is currently estimated at $510,874, approximately $203 per square foot. 169 Cranberry Dr is a home located in Augusta County with nearby schools including Riverheads Elementary School, Beverley Manor Middle School, and Riverheads High School.
Ownership History
Date
Name
Owned For
Owner Type
Purchase Details
Closed on
Aug 14, 2007
Sold by
Richards George W and Richards Barbara Q
Bought by
Findley John M and Findley Bonnie K
Current Estimated Value
Home Financials for this Owner
Home Financials are based on the most recent Mortgage that was taken out on this home.
Original Mortgage
$269,500
Outstanding Balance
$168,517
Interest Rate
6.78%
Mortgage Type
New Conventional
Estimated Equity
$342,357
Create a Home Valuation Report for This Property
The Home Valuation Report is an in-depth analysis detailing your home's value as well as a comparison with similar homes in the area
Purchase History
| Date | Buyer | Sale Price | Title Company |
|---|---|---|---|
| Findley John M | -- | -- |
Source: Public Records
Mortgage History
| Date | Status | Borrower | Loan Amount |
|---|---|---|---|
| Open | Findley John M | $269,500 |
Source: Public Records
Tax History
| Year | Tax Paid | Tax Assessment Tax Assessment Total Assessment is a certain percentage of the fair market value that is determined by local assessors to be the total taxable value of land and additions on the property. | Land | Improvement |
|---|---|---|---|---|
| 2025 | $2,668 | $513,000 | $70,800 | $442,200 |
| 2024 | $2,708 | $520,700 | $70,800 | $449,900 |
| 2023 | $2,065 | $327,700 | $70,900 | $256,800 |
| 2022 | $2,065 | $327,700 | $70,900 | $256,800 |
| 2021 | $2,065 | $327,700 | $70,900 | $256,800 |
| 2020 | $2,065 | $327,700 | $70,900 | $256,800 |
| 2019 | $2,065 | $327,700 | $70,900 | $256,800 |
| 2018 | $1,869 | $296,679 | $70,900 | $225,779 |
| 2017 | $1,721 | $296,679 | $70,900 | $225,779 |
| 2016 | $1,721 | $296,679 | $70,900 | $225,779 |
| 2015 | $1,410 | $296,679 | $70,900 | $225,779 |
| 2014 | $1,410 | $296,679 | $70,900 | $225,779 |
| 2013 | $1,410 | $293,700 | $70,900 | $222,800 |
Source: Public Records
Map
Nearby Homes
- 241 Bowmans Run Dr
- TBD Howardsville Turnpike
- TBD Churchmans Mill Rd
- TBD Gerties Ln
- 0 Kiley Ln Unit 569156
- tbd Mill Creek Ln
- TBD Cold Springs Rd
- 38 Shady Pond Ln
- 000 Stuarts Draft Hwy
- 1800 Stuarts Draft Hwy
- 911 Old White Hill Rd
- 0 Johnson Dr Unit 663189
- 1636 Stuarts Draft Hwy
- 14 Lookover Terrace
- 157 Lookover Terrace
- 86 Lookover Terrace
- 98 Rebecca Ct
- 1448 Stuarts Draft Hwy
- 12 Ceocia Ln
- 124 Forest Springs Dr
- LOT 41 Cranberry Dr
- 187 Cranberry Dr
- 232 Cranberry Dr
- 156 Cranberry Dr
- 149 Cranberry Dr
- 205 Cranberry Dr
- 126 Cranberry Dr
- 217 Cranberry Dr
- 103 Cranberry Dr
- 119 Cranberry Dr
- 229 Cranberry Dr
- 101 Cranberry Dr
- 108 Cranberry Dr
- 238 Cranberry Dr
- 241 Cranberry Dr
- 99 Cranberry Dr
- 979 Cold Springs Rd
- 257 Cranberry Dr
- 88 Cranberry Dr
- 81 Cranberry Dr
Your Personal Tour Guide
Ask me questions while you tour the home.