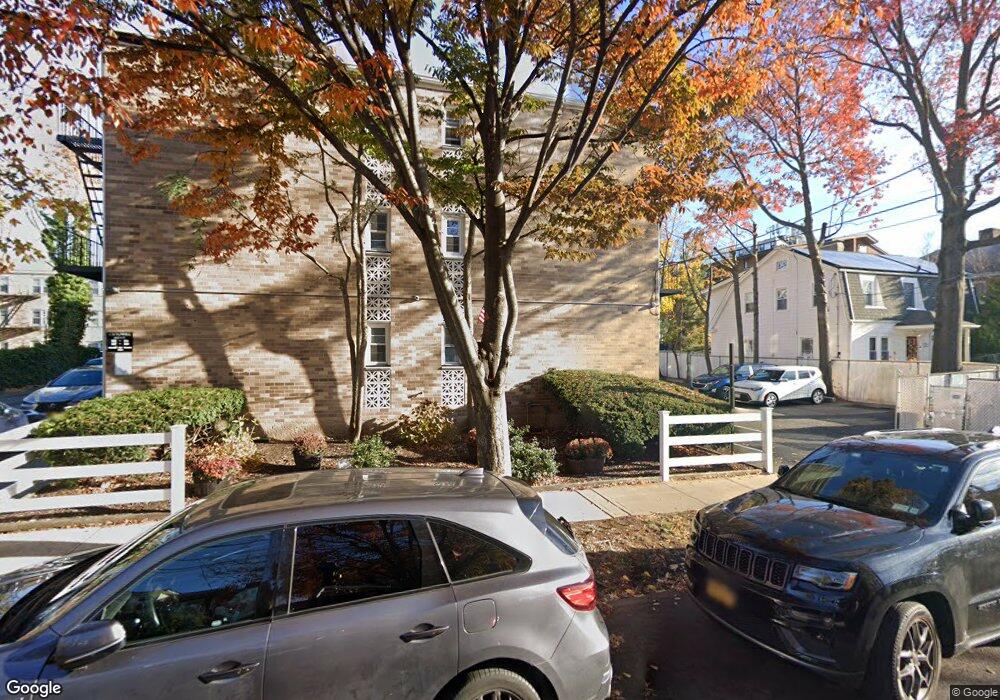
169 Cromwell Ave Unit 1D Staten Island, NY 10304
Dongan Hills NeighborhoodEstimated Value: $291,067 - $340,000
1
Bed
1
Bath
651
Sq Ft
$492/Sq Ft
Est. Value
About This Home
This home is located at 169 Cromwell Ave Unit 1D, Staten Island, NY 10304 and is currently estimated at $320,267, approximately $491 per square foot. 169 Cromwell Ave Unit 1D is a home located in Richmond County with nearby schools including P.S. 11 Thomas Dongan School, Is 2 George L Egbert, and New Dorp High School.
Ownership History
Date
Name
Owned For
Owner Type
Purchase Details
Closed on
Feb 24, 2011
Sold by
Ruane Patricia
Bought by
Chitty Susan M
Current Estimated Value
Purchase Details
Closed on
Jan 14, 2008
Sold by
Ruane John and Ruane Patricia
Bought by
Ruane Patricia
Purchase Details
Closed on
Aug 18, 1998
Sold by
Fiore Ernest
Bought by
Ruane John and Ruane Patricia
Create a Home Valuation Report for This Property
The Home Valuation Report is an in-depth analysis detailing your home's value as well as a comparison with similar homes in the area
Home Values in the Area
Average Home Value in this Area
Purchase History
| Date | Buyer | Sale Price | Title Company |
|---|---|---|---|
| Chitty Susan M | $160,000 | None Available | |
| Ruane Patricia | $75,000 | Fidelity Natl Title Ins Co | |
| Ruane John | $60,000 | Fidelity National Title Ins |
Source: Public Records
Tax History Compared to Growth
Tax History
| Year | Tax Paid | Tax Assessment Tax Assessment Total Assessment is a certain percentage of the fair market value that is determined by local assessors to be the total taxable value of land and additions on the property. | Land | Improvement |
|---|---|---|---|---|
| 2025 | $2,914 | $25,803 | $5,764 | $20,039 |
| 2024 | $2,095 | $24,225 | $5,764 | $18,461 |
| 2023 | $1,997 | $22,637 | $5,764 | $16,873 |
| 2022 | $1,908 | $24,846 | $5,764 | $19,082 |
| 2021 | $2,352 | $19,171 | $5,764 | $13,407 |
| 2020 | $1,881 | $22,274 | $5,764 | $16,510 |
| 2019 | $1,850 | $20,846 | $5,764 | $15,082 |
| 2018 | $2,449 | $21,316 | $5,764 | $15,552 |
| 2017 | $2,356 | $20,917 | $5,763 | $15,154 |
| 2016 | $2,200 | $19,508 | $5,764 | $13,744 |
| 2015 | $1,866 | $19,578 | $5,763 | $13,815 |
| 2014 | $1,866 | $14,967 | $5,763 | $9,204 |
Source: Public Records
Map
Nearby Homes
- 163 Cromwell Ave Unit 3B
- 165 Cromwell Ave Unit 3C
- 137 Delaware Ave
- 90 Alter Ave
- 76 Jefferson St
- 91 Alter Ave
- 82 Delaware Ave
- 240 Alter Ave
- 119 Raritan Ave
- 34 Bear St
- 65 Alter Ave
- 107 Jefferson St
- 169 Atlantic Ave
- 130 Jefferson St
- 102 Burgher Ave
- 260 Garretson Ave
- 287 Alter Ave
- 138 Buel Ave
- 286 Raritan Ave
- 453 N Railroad Ave
- 169 Cromwell Ave Unit 3D
- 169 Cromwell Ave Unit 3C
- 169 Cromwell Ave Unit 3B
- 169 Cromwell Ave Unit 3A
- 169 Cromwell Ave Unit 2D
- 169 Cromwell Ave Unit 2C
- 169 Cromwell Ave Unit 2B
- 169 Cromwell Ave Unit 2A
- 169 Cromwell Ave Unit 1C
- 169 Cromwell Ave Unit 1B
- 169 Cromwell Ave Unit 1A
- 165 Cromwell Ave Unit 3D
- 165 Cromwell Ave Unit 3B
- 165 Cromwell Ave Unit 3A
- 165 Cromwell Ave Unit 2D
- 165 Cromwell Ave Unit 2C
- 165 Cromwell Ave Unit 2B
- 165 Cromwell Ave Unit 2A
- 165 Cromwell Ave Unit 1D
- 165 Cromwell Ave Unit 1C