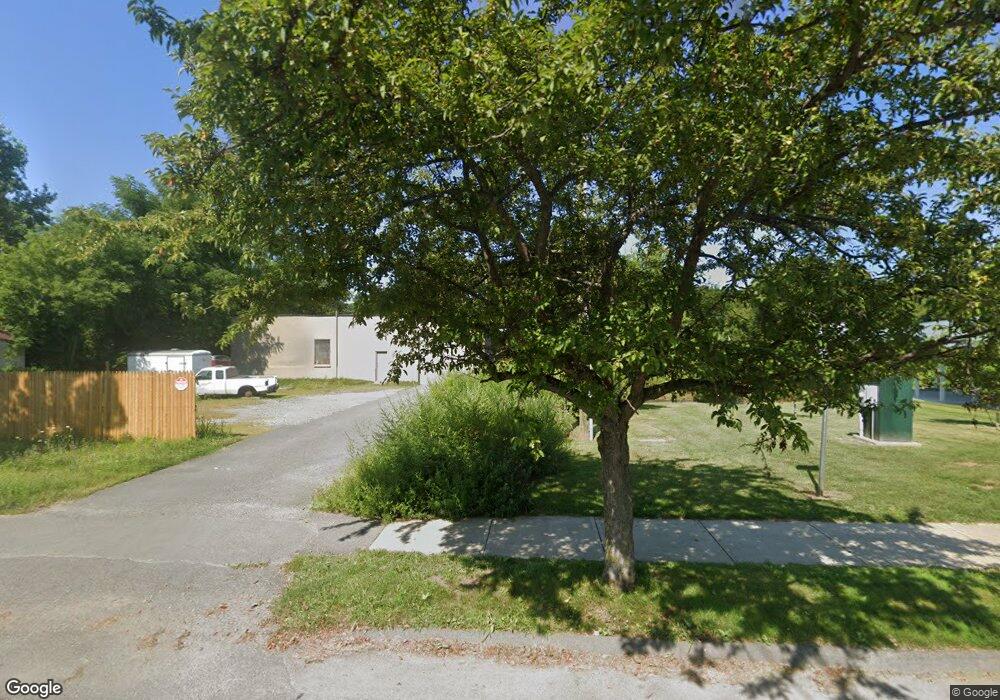
169 Dewey Ave Pittsfield, MA 01201
Estimated Value: $60,000
3
Beds
1
Bath
1,520
Sq Ft
$39/Sq Ft
Est. Value
About This Home
This home is located at 169 Dewey Ave, Pittsfield, MA 01201 and is currently priced at $60,000, approximately $39 per square foot. 169 Dewey Ave is a home located in Berkshire County with nearby schools including Silvio O. Conte Community School, John T. Reid Middle School, and Taconic High School.
Ownership History
Date
Name
Owned For
Owner Type
Purchase Details
Closed on
Feb 25, 2005
Sold by
Beneficial Mtg Co
Bought by
Duncan Kenneth
Current Estimated Value
Purchase Details
Closed on
Sep 5, 2003
Sold by
Beneficial Mtg Co Of M and Boulerice
Bought by
Beneficial Mtg Co Of M
Purchase Details
Closed on
Aug 12, 1997
Sold by
Sandifer Sarah L
Bought by
Boulerice Edward R and Boulerice Shadi Fawkia
Home Financials for this Owner
Home Financials are based on the most recent Mortgage that was taken out on this home.
Original Mortgage
$38,659
Interest Rate
7.5%
Mortgage Type
Purchase Money Mortgage
Create a Home Valuation Report for This Property
The Home Valuation Report is an in-depth analysis detailing your home's value as well as a comparison with similar homes in the area
Home Values in the Area
Average Home Value in this Area
Purchase History
| Date | Buyer | Sale Price | Title Company |
|---|---|---|---|
| Duncan Kenneth | $21,000 | -- | |
| Beneficial Mtg Co Of M | $25,000 | -- | |
| Boulerice Edward R | $37,500 | -- |
Source: Public Records
Mortgage History
| Date | Status | Borrower | Loan Amount |
|---|---|---|---|
| Previous Owner | Boulerice Edward R | $38,659 |
Source: Public Records
Tax History Compared to Growth
Tax History
| Year | Tax Paid | Tax Assessment Tax Assessment Total Assessment is a certain percentage of the fair market value that is determined by local assessors to be the total taxable value of land and additions on the property. | Land | Improvement |
|---|---|---|---|---|
| 2025 | -- | $90,700 | $15,400 | $75,300 |
| 2024 | -- | $86,600 | $15,400 | $71,200 |
| 2023 | $0 | $80,200 | $15,400 | $64,800 |
| 2022 | $0 | $68,700 | $12,300 | $56,400 |
| 2021 | $0 | $76,400 | $22,600 | $53,800 |
| 2020 | $0 | $74,600 | $22,600 | $52,000 |
| 2019 | $0 | $80,600 | $24,400 | $56,200 |
| 2018 | $0 | $78,600 | $24,400 | $54,200 |
| 2017 | -- | $82,100 | $25,800 | $56,300 |
| 2016 | -- | $82,300 | $25,800 | $56,500 |
| 2015 | -- | $82,300 | $25,800 | $56,500 |
Source: Public Records
Map
Nearby Homes