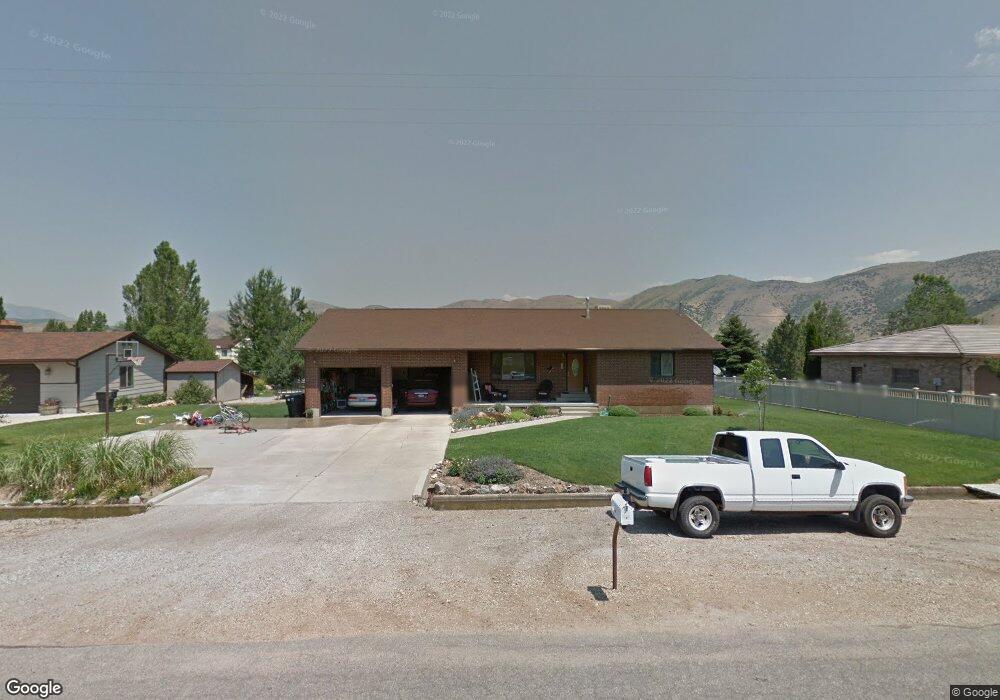
169 E Fish Hatchery Rd Mantua, UT 84324
Estimated Value: $339,079 - $373,000
2
Beds
1
Bath
1,368
Sq Ft
$262/Sq Ft
Est. Value
About This Home
This home is located at 169 E Fish Hatchery Rd, Mantua, UT 84324 and is currently estimated at $358,020, approximately $261 per square foot. 169 E Fish Hatchery Rd is a home located in Box Elder County with nearby schools including Golden Spike Elementary, Box Elder Middle School, and Adele C. Young Intermediate School.
Ownership History
Date
Name
Owned For
Owner Type
Purchase Details
Closed on
Jun 10, 2025
Sold by
Thorah Richards Living Trust and Scoffield Janette Rae
Bought by
Webster Adam Daniel
Current Estimated Value
Home Financials for this Owner
Home Financials are based on the most recent Mortgage that was taken out on this home.
Original Mortgage
$353,479
Outstanding Balance
$351,001
Interest Rate
6.76%
Mortgage Type
FHA
Estimated Equity
$7,019
Purchase Details
Closed on
Sep 13, 2024
Sold by
Richards Thora H
Bought by
Thora H Richards Living Trust and Scoffield
Purchase Details
Closed on
Mar 4, 2014
Sold by
Richards Steven Dean and Richards Kevin Wight
Bought by
Richards Dean L and Richards Thora H
Create a Home Valuation Report for This Property
The Home Valuation Report is an in-depth analysis detailing your home's value as well as a comparison with similar homes in the area
Purchase History
| Date | Buyer | Sale Price | Title Company |
|---|---|---|---|
| Webster Adam Daniel | -- | Phillips Hansen Land Title | |
| Webster Adam Daniel | -- | Phillips Hansen Land Title | |
| Thora H Richards Living Trust | -- | Heritage West Title | |
| Richards Dean L | -- | None Available |
Source: Public Records
Mortgage History
| Date | Status | Borrower | Loan Amount |
|---|---|---|---|
| Open | Webster Adam Daniel | $353,479 | |
| Closed | Webster Adam Daniel | $353,479 |
Source: Public Records
Tax History
| Year | Tax Paid | Tax Assessment Tax Assessment Total Assessment is a certain percentage of the fair market value that is determined by local assessors to be the total taxable value of land and additions on the property. | Land | Improvement |
|---|---|---|---|---|
| 2025 | $1,948 | $334,994 | $104,250 | $230,744 |
| 2024 | $1,695 | $326,252 | $99,250 | $227,002 |
| 2023 | $1,775 | $349,856 | $94,250 | $255,606 |
| 2022 | $125 | $172,879 | $21,588 | $151,291 |
| 2021 | $1,354 | $193,566 | $39,250 | $154,316 |
| 2020 | $1,191 | $193,566 | $39,250 | $154,316 |
| 2019 | $1,119 | $96,698 | $21,588 | $75,110 |
| 2018 | $483 | $94,568 | $21,588 | $72,980 |
| 2017 | $786 | $117,010 | $16,500 | $87,010 |
| 2016 | $497 | $62,077 | $16,500 | $45,577 |
| 2015 | $772 | $57,933 | $16,500 | $41,433 |
| 2014 | $772 | $55,960 | $16,500 | $39,460 |
| 2013 | -- | $55,960 | $16,500 | $39,460 |
Source: Public Records
Map
Nearby Homes
- 263 E Fish Hatchery Rd
- 67 E Center St
- 534 E Fish Hatchery Rd
- 1623 Willard Peak Rd Unit 1
- 1705 Willard Peak Rd Unit 2
- 214 W Center St
- 91 U S 89
- 951 N Main St
- 64 N Bywater Way
- 1228 Sheri Cir
- 624 S 900 E
- 637 E 950 S Unit 20
- 637 E 950 S Unit 19
- 637 E 950 S Unit 6
- 1066 Beecher Ave
- 770 E 350 S
- 800 E 100 S Unit 1
- 780 E 100 S Unit 1
- 885 S Arapaho Ct Unit 10
- 867 S Arapaho Ct
- 169 E Fish Hatchery Rd
- 185 E Fish Hatchery Rd
- 159 E Fish Hatchery Rd
- 219 S Meadow Rd
- 149 E Fish Hatchery Rd
- 204 S Meadow Rd
- 207 S Meadow Rd
- 207 E Rocky Dugway Rd
- 192 S Meadow Rd
- 139 E Fish Hatchery Rd
- 184 S Meadow Rd
- 162 E Fish Hatchery Rd
- 125 E Fish Hatchery Rd
- 183 S Meadow Rd
- 172 S Meadow Rd
- 119 E Fish Hatchery Rd
- 178 E Lake View Dr
- 158 E 300 S
- 168 E 300 S
- 225 E Fish Hatchery Rd
Your Personal Tour Guide
Ask me questions while you tour the home.