
Seller's Agent in 2021
Scott Rausch, REALTOR
Rausch & Associates
(989) 529-9671
27 in this area
60 Total Sales
Estimated Value: $154,770
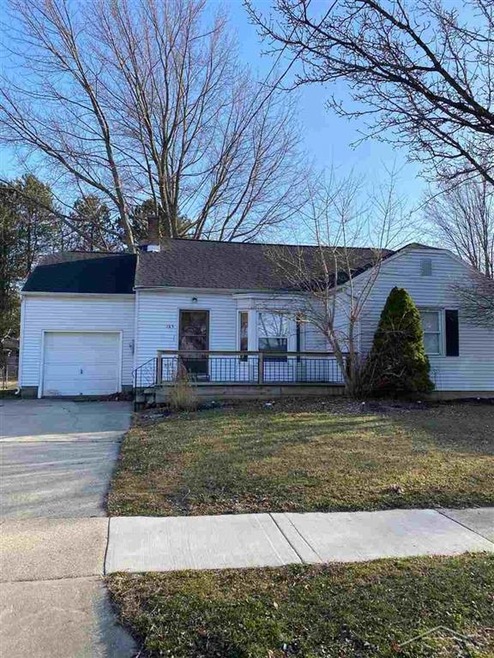
Immediate possession! Residential/duplex located in the City of Frankenmuth. 3 bedrooms, 3 baths, full basement and 1 car attached garage. Priced to sell at $149,900!
Last Agent to Sell the Property
Rausch & Associates License #SBR-6504120278 Listed on: 03/24/2021
Last Buyer's Agent
Rausch & Associates License #SBR-6504120278 Listed on: 03/24/2021
We collect this data history from publicly available records. To have your information removed, we recommend requesting removal directly through your county’s website.
| Date | Buyer | Sale Price | Title Company |
|---|---|---|---|
| Gen 6 Plus Llc | -- | Clark Hill Plc | |
| Gen 6 Properties Llc | $138,500 | Crossroads Title | |
| Johnston David R | $117,000 | -- | |
| Johnston Carol A | -- | -- |
| Date | Event | Price | List to Sale | Price per Sq Ft |
|---|---|---|---|---|
| 05/05/2021 05/05/21 | Sold | $137,500 | -8.3% | $127 / Sq Ft |
| 03/25/2021 03/25/21 | Pending | -- | -- | -- |
| 03/24/2021 03/24/21 | For Sale | $149,900 | -- | $139 / Sq Ft |
| Year | Tax Paid | Tax Assessment Tax Assessment Total Assessment is a certain percentage of the fair market value that is determined by local assessors to be the total taxable value of land and additions on the property. | Land | Improvement |
|---|---|---|---|---|
| 2025 | $1,063 | $47,200 | $0 | $0 |
| 2024 | $1,038 | $46,600 | $0 | $0 |
| 2023 | $1,210 | $43,900 | $0 | $0 |
| 2022 | $2,406 | $42,700 | $0 | $0 |
| 2021 | $2,464 | $72,100 | $0 | $0 |
| 2020 | $2,420 | $58,900 | $0 | $0 |
| 2019 | $2,059 | $50,000 | $0 | $0 |
| 2018 | $928 | $50,900 | $0 | $0 |
| 2017 | $1,899 | $49,500 | $0 | $0 |
| 2016 | $1,890 | $45,000 | $0 | $0 |
| 2014 | -- | $40,900 | $0 | $25,600 |
| 2013 | -- | $37,300 | $0 | $0 |
Seller's Agent in 2021
Scott Rausch, REALTOR
Rausch & Associates
(989) 529-9671
27 in this area
60 Total Sales
Source: Michigan Multiple Listing Service
MLS Number: 50037098
APN: 03116340306000
Disclaimer: Certain information contained herein is derived from information provided by parties other than Homes.com. All information provided is deemed reliable, but is not guaranteed to be accurate and should be independently verified.
![]() Source MLS: MiRealSource
Source MLS: MiRealSource
Provided through IDX via MiRealSource. Courtesy of MiRealSource Shareholder. Copyright MiRealSource.
The information published and disseminated by MiRealSource is communicated verbatim, without change by MiRealSource, as filed with MiRealSource by its members. The accuracy of all information, regardless of source, is not guaranteed or warranted. All information should be independently verified.
Copyright 2026 MiRealSource. All rights reserved. The information provided hereby constitutes proprietary information of MiRealSource, Inc. and its shareholders, affiliates and licensees and may not be reproduced or transmitted in any form or by any means, electronic or mechanical, including photocopy, recording, scanning or any information storage and retrieval system, without written permission from MiRealSource, Inc.
Ask me questions while you tour the home.