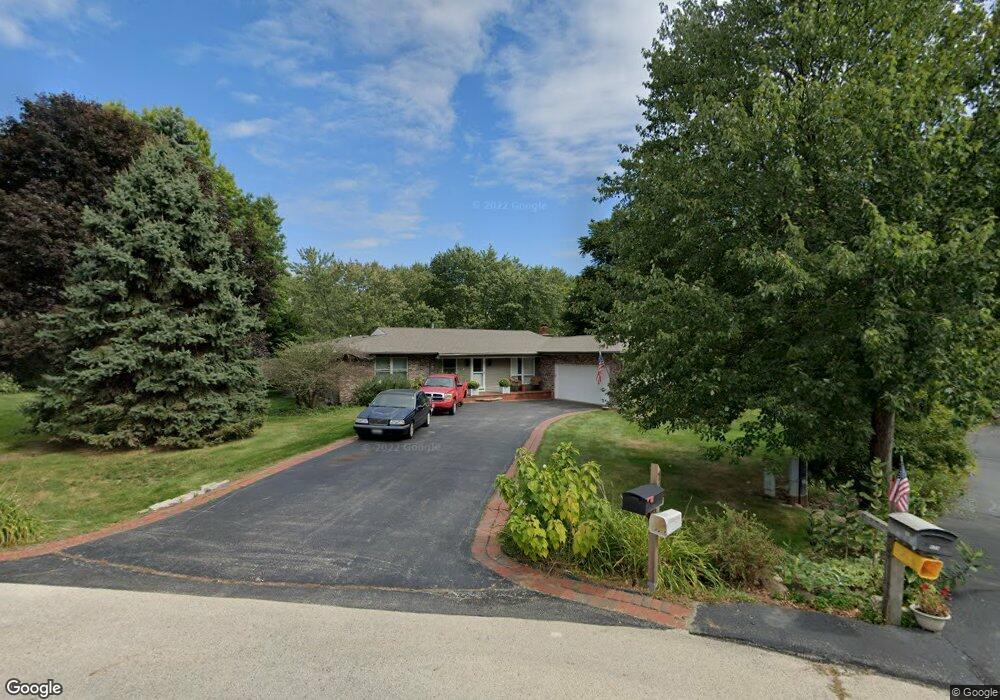
169 Hilltop Ln Sleepy Hollow, IL 60118
Estimated Value: $437,833 - $515,000
4
Beds
--
Bath
2,684
Sq Ft
$182/Sq Ft
Est. Value
About This Home
This home is located at 169 Hilltop Ln, Sleepy Hollow, IL 60118 and is currently estimated at $488,958, approximately $182 per square foot. 169 Hilltop Ln is a home located in Kane County with nearby schools including Sleepy Hollow Elementary School, Dundee Middle School, and Dundee-Crown High School.
Ownership History
Date
Name
Owned For
Owner Type
Purchase Details
Closed on
Oct 20, 1995
Sold by
Boe Ellis R and Boe Gladys S
Bought by
Boe Gladys S and Gladys S Boe Revocable Trust
Current Estimated Value
Create a Home Valuation Report for This Property
The Home Valuation Report is an in-depth analysis detailing your home's value as well as a comparison with similar homes in the area
Home Values in the Area
Average Home Value in this Area
Purchase History
| Date | Buyer | Sale Price | Title Company |
|---|---|---|---|
| Boe Gladys S | -- | -- |
Source: Public Records
Tax History Compared to Growth
Tax History
| Year | Tax Paid | Tax Assessment Tax Assessment Total Assessment is a certain percentage of the fair market value that is determined by local assessors to be the total taxable value of land and additions on the property. | Land | Improvement |
|---|---|---|---|---|
| 2024 | $8,470 | $128,892 | $32,970 | $95,922 |
| 2023 | $8,020 | $115,972 | $29,665 | $86,307 |
| 2022 | $7,569 | $103,297 | $29,665 | $73,632 |
| 2021 | $7,308 | $97,533 | $28,010 | $69,523 |
| 2020 | $7,164 | $95,340 | $27,380 | $67,960 |
| 2019 | $6,939 | $90,507 | $25,992 | $64,515 |
| 2018 | $6,254 | $80,241 | $25,477 | $54,764 |
| 2017 | $5,966 | $75,062 | $23,833 | $51,229 |
| 2016 | $5,595 | $67,649 | $26,123 | $41,526 |
| 2015 | -- | $63,389 | $24,478 | $38,911 |
| 2014 | -- | $66,963 | $23,802 | $43,161 |
| 2013 | -- | $69,013 | $24,531 | $44,482 |
Source: Public Records
Map
Nearby Homes
- 1149 Gail Ln
- 1022 Beau Brummel Dr
- 215 Hilltop Ln
- 506 Stevens Ct
- 522 Joy Ln
- 936 Glen Oak Dr
- 616 Joy Ln Unit 15
- 325 Sharon Dr
- 2622 Wessex Dr
- 747 Jamestowne Ct
- 36W650 Hickory Hollow Dr
- 2622 Chesire Ct
- 36W251 Oak Hill Dr
- 215 Sharon Dr
- 1601 Higgins Rd
- 937 Willow Ln
- 1214 Carol Crest Dr
- 1715 W Main St
- 2131 Stewart Ln
- 842 Winmoor Dr
- 171 Hilltop Ln
- 167 Hilltop Ln
- 172 Hilltop Ln
- 165 Hilltop Ln
- 1030 Beau Brummel Dr
- 110 Hilltop Ln
- 112 Hilltop Ln
- 175 Hilltop Ln
- 1220 Timber Dr
- 163 Hilltop Ln
- 1102 Crane Dr
- 1219 Timber Dr
- 114 Hilltop Ln
- 1147 Gail Ln
- 1218 Timber Dr
- 161 Hilltop Ln
- 168 Hilltop Ln
- 1145 Gail Ln
- 1033 Beau Brummel Dr
- 121 Hilltop Ln