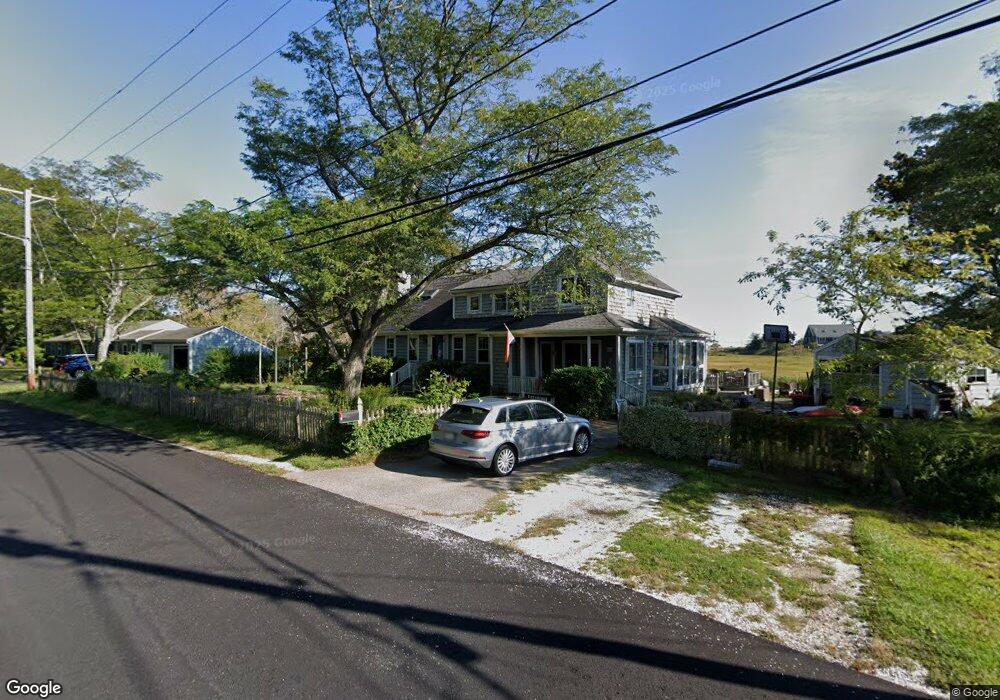
169 Kent St Scituate, MA 02066
Estimated Value: $1,066,238 - $1,119,000
2
Beds
2
Baths
2,254
Sq Ft
$486/Sq Ft
Est. Value
About This Home
This home is located at 169 Kent St, Scituate, MA 02066 and is currently estimated at $1,096,060, approximately $486 per square foot. 169 Kent St is a home located in Plymouth County with nearby schools including Jenkins Elementary School, Lester J. Gates Middle School, and Scituate High School.
Ownership History
Date
Name
Owned For
Owner Type
Purchase Details
Closed on
Oct 31, 1996
Sold by
Odonnell Brian F and Odonnell Olga S
Bought by
Yonce John P and Yonce Elizabeth
Current Estimated Value
Purchase Details
Closed on
Oct 7, 1993
Sold by
Nagorka Peter R
Bought by
Odonnell Brian F and Odonnell Olga S
Purchase Details
Closed on
Sep 26, 1987
Sold by
Buick David
Bought by
Nagorka Peter R
Create a Home Valuation Report for This Property
The Home Valuation Report is an in-depth analysis detailing your home's value as well as a comparison with similar homes in the area
Home Values in the Area
Average Home Value in this Area
Purchase History
| Date | Buyer | Sale Price | Title Company |
|---|---|---|---|
| Yonce John P | $229,000 | -- | |
| Odonnell Brian F | $224,000 | -- | |
| Nagorka Peter R | $251,000 | -- |
Source: Public Records
Mortgage History
| Date | Status | Borrower | Loan Amount |
|---|---|---|---|
| Open | Nagorka Peter R | $301,500 | |
| Closed | Nagorka Peter R | $316,000 | |
| Closed | Nagorka Peter R | $175,000 |
Source: Public Records
Tax History
| Year | Tax Paid | Tax Assessment Tax Assessment Total Assessment is a certain percentage of the fair market value that is determined by local assessors to be the total taxable value of land and additions on the property. | Land | Improvement |
|---|---|---|---|---|
| 2025 | $8,496 | $850,500 | $513,900 | $336,600 |
| 2024 | $8,310 | $802,100 | $467,200 | $334,900 |
| 2023 | $7,297 | $727,300 | $424,800 | $302,500 |
| 2022 | $7,297 | $578,200 | $324,100 | $254,100 |
| 2021 | $7,042 | $528,300 | $308,700 | $219,600 |
| 2020 | $6,834 | $506,200 | $296,700 | $209,500 |
| 2019 | $7,154 | $520,700 | $320,000 | $200,700 |
| 2018 | $7,315 | $524,400 | $336,200 | $188,200 |
| 2017 | $7,051 | $500,400 | $312,200 | $188,200 |
| 2016 | $6,567 | $464,400 | $276,200 | $188,200 |
| 2015 | $5,926 | $452,400 | $264,200 | $188,200 |
Source: Public Records
Map
Nearby Homes
- 59 Greenfield Ln
- 24 Ridge Hill Rd
- 15 Bearce Ln
- 20 Meeting House Ln
- 55 Crescent Ave
- 50 First Parish Rd
- 91 Front St Unit 106
- 34 Ladds Way
- 25 Morton Place
- 33 Beaver Dam Rd
- 21 Jenkins Place
- 46 Tilden Rd
- 23 Sunset Rd
- 14 Old Country Way Unit C
- 14 Old Country Way Unit B
- 19 Ford Place Unit 1
- 19 Ford Place Unit 2
- 21 Circuit Ave
- 138 Judge Cushing Rd
- 11 Brookline Rd
Your Personal Tour Guide
Ask me questions while you tour the home.