
Seller's Agent in 2024
Amanda Armstrong
Compass
(978) 879-6322
3 in this area
227 Total Sales
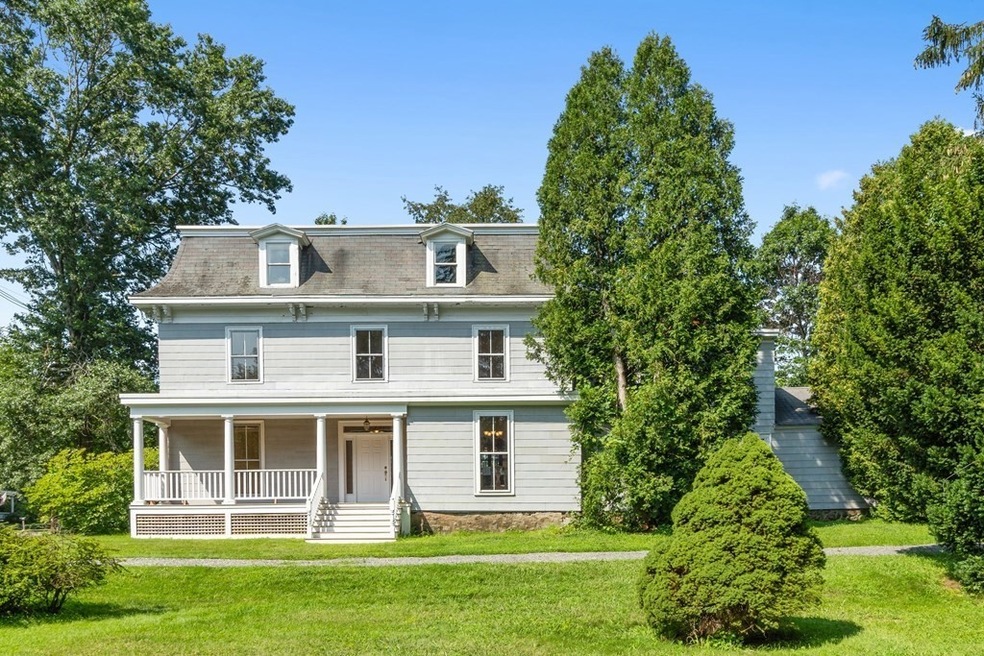


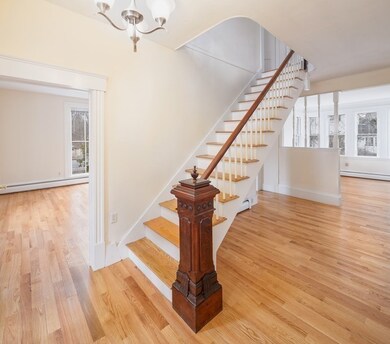

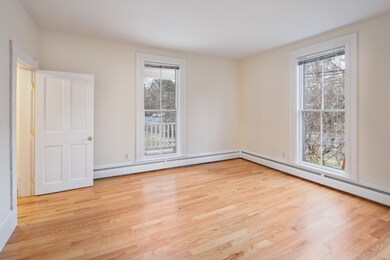
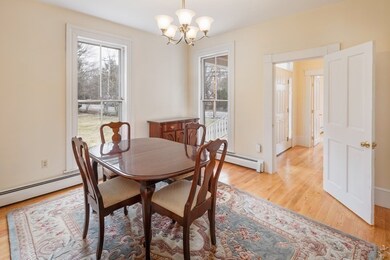
Welcome to the Village of Wenham! Instantly appealing the minute you enter the front foyer. You will notice the soaring ceilings, large windows, spacious sunny rooms, gleaming hardwood floors, Old World Charm and the open ambiance. This precious home has lots of options for today’s lifestyles. Plenty of bedrooms for the need of extended families. In home offices with abundance of privacy. Known as “The Franklin Hadley House”. Mr. Hadley represented the Great and General Court of Massachusetts and oversaw the construction of the Town Hall in 1854. Convenient to downtown, schools, train station, post office, Patton Park, Pingree Field and Wenham Tea House Playground. Such a fun place to live and raise your family. Beautiful grounds on over 3.69 acres of land. Expansion possibilities. You will be proud to call this home. 14 rooms in total, 4,305 sq. ft. of living space.
| Date | Type | Sale Price | Title Company |
|---|---|---|---|
| Deed | -- | -- |
| Date | Status | Loan Amount | Loan Type |
|---|---|---|---|
| Open | $280,000 | No Value Available | |
| Closed | $250,000 | No Value Available | |
| Closed | $150,000 | No Value Available |
| Date | Event | Price | Change | Sq Ft Price |
|---|---|---|---|---|
| 07/21/2025 07/21/25 | Price Changed | $3,100,000 | -7.5% | $618 / Sq Ft |
| 05/30/2025 05/30/25 | Price Changed | $3,350,000 | -2.9% | $668 / Sq Ft |
| 04/07/2025 04/07/25 | Price Changed | $3,450,000 | -2.8% | $688 / Sq Ft |
| 11/04/2024 11/04/24 | Price Changed | $3,550,000 | -3.9% | $708 / Sq Ft |
| 06/28/2024 06/28/24 | For Sale | $3,695,000 | +427.9% | $737 / Sq Ft |
| 10/28/2021 10/28/21 | Sold | $700,000 | -29.9% | $163 / Sq Ft |
| 10/12/2021 10/12/21 | Pending | -- | -- | -- |
| 06/02/2021 06/02/21 | Price Changed | $999,000 | -9.2% | $232 / Sq Ft |
| 05/18/2021 05/18/21 | Price Changed | $1,100,000 | -8.3% | $256 / Sq Ft |
| 03/25/2021 03/25/21 | For Sale | $1,200,000 | -- | $279 / Sq Ft |
| Year | Tax Paid | Tax Assessment Tax Assessment Total Assessment is a certain percentage of the fair market value that is determined by local assessors to be the total taxable value of land and additions on the property. | Land | Improvement |
|---|---|---|---|---|
| 2025 | $41,938 | $2,698,700 | $668,200 | $2,030,500 |
| 2024 | $37,939 | $2,422,700 | $668,200 | $1,754,500 |
| 2023 | $13,519 | $779,200 | $580,200 | $199,000 |
| 2022 | $15,852 | $809,600 | $596,400 | $213,200 |
| 2021 | $15,079 | $766,200 | $553,000 | $213,200 |
| 2020 | $14,017 | $740,100 | $553,100 | $187,000 |
| 2019 | $13,337 | $740,100 | $553,100 | $187,000 |
| 2018 | $15,197 | $808,800 | $641,600 | $167,200 |
| 2017 | $14,825 | $808,800 | $641,600 | $167,200 |
| 2016 | $13,733 | $808,800 | $641,600 | $167,200 |
| 2015 | $13,143 | $808,800 | $641,600 | $167,200 |
Seller's Agent in 2024
Amanda Armstrong
Compass
(978) 879-6322
3 in this area
227 Total Sales
Seller's Agent in 2021
Kristin Kelly
J. Barrett & Company
(978) 973-6280
3 in this area
64 Total Sales
Buyer's Agent in 2021
Katie McClain
Engel & Volkers By the Sea
(978) 509-8164
8 in this area
26 Total Sales
Source: MLS Property Information Network (MLS PIN)
MLS Number: 72806410
APN: WENH-000013-000000-000135
Disclaimer: Certain information contained herein is derived from information provided by parties other than Homes.com. All information provided is deemed reliable, but is not guaranteed to be accurate and should be independently verified.
![]() The property listing data and information, or the Images, set forth herein were provided to MLS Property Information Network, Inc. from third party sources, including sellers, lessors and public records, and were compiled by MLS Property Information Network, Inc. The property listing data and information, and the Images, are for the personal, non-commercial use of consumers having a good faith interest in purchasing or leasing listed properties of the type displayed to them and may not be used for any purpose other than to identify prospective properties which such consumers may have a good faith interest in purchasing or leasing. MLS Property Information Network, Inc. and its subscribers disclaim any and all representations and warranties as to the accuracy of the property listing data and information, or as to the accuracy of any of the Images, set forth herein.
The property listing data and information, or the Images, set forth herein were provided to MLS Property Information Network, Inc. from third party sources, including sellers, lessors and public records, and were compiled by MLS Property Information Network, Inc. The property listing data and information, and the Images, are for the personal, non-commercial use of consumers having a good faith interest in purchasing or leasing listed properties of the type displayed to them and may not be used for any purpose other than to identify prospective properties which such consumers may have a good faith interest in purchasing or leasing. MLS Property Information Network, Inc. and its subscribers disclaim any and all representations and warranties as to the accuracy of the property listing data and information, or as to the accuracy of any of the Images, set forth herein.