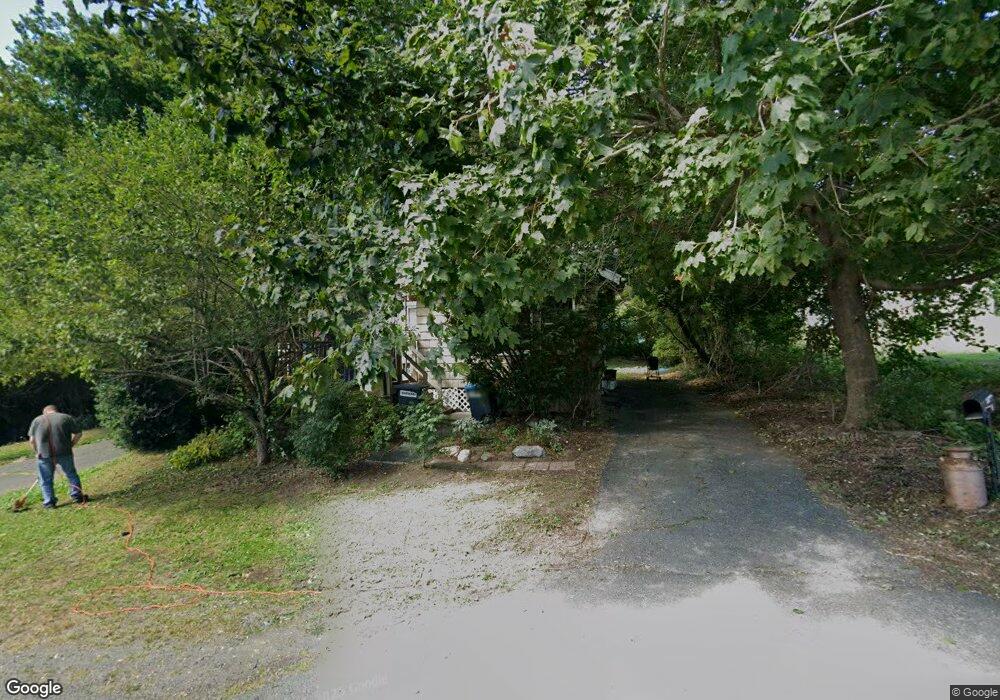
169 Mohegan St Pittsfield, MA 01201
Estimated Value: $155,000 - $214,000
2
Beds
1
Bath
576
Sq Ft
$321/Sq Ft
Est. Value
About This Home
This home is located at 169 Mohegan St, Pittsfield, MA 01201 and is currently estimated at $185,170, approximately $321 per square foot. 169 Mohegan St is a home located in Berkshire County with nearby schools including Morningside Community School, John T. Reid Middle School, and Taconic High School.
Ownership History
Date
Name
Owned For
Owner Type
Purchase Details
Closed on
Oct 12, 2021
Sold by
Ellsworth Darrell K
Bought by
Ellsworth Tami S
Current Estimated Value
Purchase Details
Closed on
Feb 22, 2002
Sold by
Race Gregory E
Bought by
Ellsworth Darrell K and Ellsworth Tami S
Home Financials for this Owner
Home Financials are based on the most recent Mortgage that was taken out on this home.
Original Mortgage
$55,800
Interest Rate
7.08%
Mortgage Type
Purchase Money Mortgage
Purchase Details
Closed on
Nov 15, 2001
Sold by
Olds Walter B and Olds Sandra M
Bought by
Race Gregory E
Home Financials for this Owner
Home Financials are based on the most recent Mortgage that was taken out on this home.
Original Mortgage
$35,000
Interest Rate
6.7%
Mortgage Type
Purchase Money Mortgage
Create a Home Valuation Report for This Property
The Home Valuation Report is an in-depth analysis detailing your home's value as well as a comparison with similar homes in the area
Home Values in the Area
Average Home Value in this Area
Purchase History
| Date | Buyer | Sale Price | Title Company |
|---|---|---|---|
| Ellsworth Tami S | -- | None Available | |
| Ellsworth Tami S | -- | None Available | |
| Ellsworth Darrell K | $62,000 | -- | |
| Ellsworth Darrell K | $62,000 | -- | |
| Race Gregory E | $45,000 | -- | |
| Race Gregory E | $45,000 | -- |
Source: Public Records
Mortgage History
| Date | Status | Borrower | Loan Amount |
|---|---|---|---|
| Previous Owner | Race Gregory E | $90,000 | |
| Previous Owner | Race Gregory E | $55,800 | |
| Previous Owner | Race Gregory E | $35,000 |
Source: Public Records
Tax History Compared to Growth
Tax History
| Year | Tax Paid | Tax Assessment Tax Assessment Total Assessment is a certain percentage of the fair market value that is determined by local assessors to be the total taxable value of land and additions on the property. | Land | Improvement |
|---|---|---|---|---|
| 2025 | $2,451 | $136,600 | $54,000 | $82,600 |
| 2024 | $2,437 | $132,100 | $54,000 | $78,100 |
| 2023 | $2,290 | $125,000 | $54,000 | $71,000 |
| 2022 | $1,670 | $90,000 | $27,000 | $63,000 |
| 2021 | $1,513 | $78,600 | $27,000 | $51,600 |
| 2020 | $1,417 | $71,900 | $22,100 | $49,800 |
| 2019 | $1,398 | $72,000 | $23,900 | $48,100 |
| 2018 | $1,405 | $70,200 | $23,900 | $46,300 |
| 2017 | $1,368 | $69,700 | $25,200 | $44,500 |
| 2016 | $1,461 | $77,900 | $34,200 | $43,700 |
| 2015 | $1,407 | $77,900 | $34,200 | $43,700 |
Source: Public Records
Map
Nearby Homes