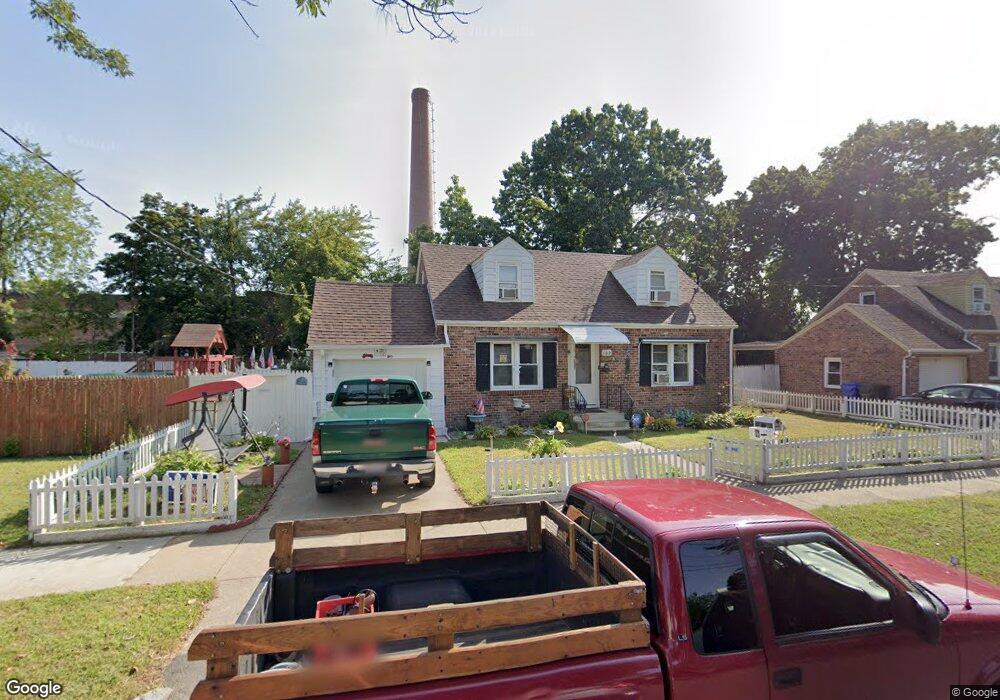
169 Monrovia St Springfield, MA 01104
East Springfield NeighborhoodEstimated Value: $259,000 - $292,000
2
Beds
1
Bath
1,240
Sq Ft
$221/Sq Ft
Est. Value
About This Home
This home is located at 169 Monrovia St, Springfield, MA 01104 and is currently estimated at $273,440, approximately $220 per square foot. 169 Monrovia St is a home located in Hampden County with nearby schools including Mary O. Pottenger Elementary School, Van Sickle Academy, and Springfield Central High School.
Ownership History
Date
Name
Owned For
Owner Type
Purchase Details
Closed on
Oct 4, 2012
Sold by
Hoynoski Chester A
Bought by
Ch Ft and Hoynoski Chester A
Current Estimated Value
Purchase Details
Closed on
Aug 1, 2008
Sold by
Bousquet Kenneth R
Bought by
Hoynoski Chester A
Home Financials for this Owner
Home Financials are based on the most recent Mortgage that was taken out on this home.
Original Mortgage
$68,000
Interest Rate
6.47%
Mortgage Type
Purchase Money Mortgage
Purchase Details
Closed on
May 27, 2008
Sold by
Deveno Armond P and Hoynoski Chester A
Bought by
Bousquet Kenneth R
Create a Home Valuation Report for This Property
The Home Valuation Report is an in-depth analysis detailing your home's value as well as a comparison with similar homes in the area
Home Values in the Area
Average Home Value in this Area
Purchase History
| Date | Buyer | Sale Price | Title Company |
|---|---|---|---|
| Ch Ft | -- | -- | |
| Hoynoski Chester A | $86,000 | -- | |
| Bousquet Kenneth R | $85,000 | -- |
Source: Public Records
Mortgage History
| Date | Status | Borrower | Loan Amount |
|---|---|---|---|
| Previous Owner | Hoynoski Chester A | $68,000 |
Source: Public Records
Tax History Compared to Growth
Tax History
| Year | Tax Paid | Tax Assessment Tax Assessment Total Assessment is a certain percentage of the fair market value that is determined by local assessors to be the total taxable value of land and additions on the property. | Land | Improvement |
|---|---|---|---|---|
| 2025 | $3,722 | $237,400 | $38,700 | $198,700 |
| 2024 | $3,763 | $234,300 | $38,700 | $195,600 |
| 2023 | $3,386 | $198,600 | $36,100 | $162,500 |
| 2022 | $2,846 | $151,200 | $33,700 | $117,500 |
| 2021 | $2,765 | $146,300 | $30,700 | $115,600 |
| 2020 | $2,871 | $147,000 | $30,700 | $116,300 |
| 2019 | $2,692 | $136,800 | $31,700 | $105,100 |
| 2018 | $2,541 | $129,100 | $31,700 | $97,400 |
| 2017 | $2,471 | $125,700 | $28,700 | $97,000 |
| 2016 | $2,471 | $125,700 | $28,700 | $97,000 |
| 2015 | $2,345 | $119,200 | $28,700 | $90,500 |
Source: Public Records
Map
Nearby Homes
- 240 El Paso St
- 16-18 Haumont Terrace
- 116 Merida St
- 254 Redlands St
- 52-54 Campechi St
- 3 Fordham St
- 143 Saint James Cir
- 61 Russell St
- 23 Corona St
- 7 Kelly Place
- 79-81 Windermere St
- 208 Osborne Terrace
- 11 Fernwold St
- 73 Melville
- 95 Victoria St
- 184 Russell St
- 0 Saint James Ave
- 24 Porter St
- 1206-1208 Saint James Ave
- 37-39 Porter St
- 175 Monrovia St
- 159 Monrovia St
- 181 Monrovia St
- 181 Monrovia St
- 60 Fresno St
- 168 Monrovia St
- 151 Monrovia St Unit 153
- 151 Monrovia St Unit 1
- 151-153 Monrovia St
- 176 Monrovia St
- 158 Monrovia St
- 187 Monrovia St
- 184 Monrovia St
- 147 Monrovia St
- 152 Monrovia St
- 188 Monrovia St
- 191 Monrovia St
- 169 Santa Barbara St
- 173 Santa Barbara St Unit 175
- 163 Santa Barbara St