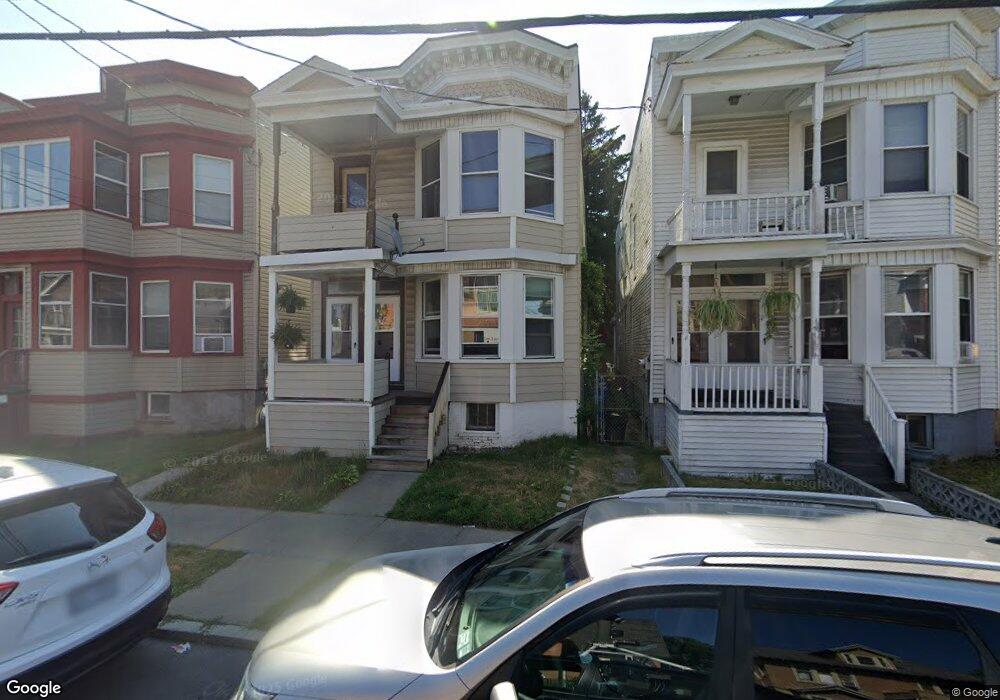
169 N Allen St Albany, NY 12206
Lower Washington Avenue NeighborhoodEstimated Value: $266,076 - $284,000
5
Beds
2
Baths
2,384
Sq Ft
$114/Sq Ft
Est. Value
About This Home
This home is located at 169 N Allen St, Albany, NY 12206 and is currently estimated at $272,269, approximately $114 per square foot. 169 N Allen St is a home located in Albany County with nearby schools including Pine Hills Elementary School, Stephen And Harriet Myers Middle School, and Albany High School.
Ownership History
Date
Name
Owned For
Owner Type
Purchase Details
Closed on
Oct 14, 2016
Sold by
D Segal Properies Llc
Bought by
Ortiz David
Current Estimated Value
Home Financials for this Owner
Home Financials are based on the most recent Mortgage that was taken out on this home.
Original Mortgage
$95,000
Outstanding Balance
$76,064
Interest Rate
3.42%
Mortgage Type
Purchase Money Mortgage
Estimated Equity
$196,205
Purchase Details
Closed on
Jan 18, 2011
Sold by
Segal Donald
Bought by
D Segal Properties Llc
Purchase Details
Closed on
Apr 1, 2002
Sold by
Hemlock Jay
Bought by
Segal Donald
Create a Home Valuation Report for This Property
The Home Valuation Report is an in-depth analysis detailing your home's value as well as a comparison with similar homes in the area
Home Values in the Area
Average Home Value in this Area
Purchase History
| Date | Buyer | Sale Price | Title Company |
|---|---|---|---|
| Ortiz David | $105,000 | None Available | |
| D Segal Properties Llc | -- | -- | |
| D Segal Properties Llc | -- | None Available | |
| Segal Donald | $62,681 | Stanley Segal |
Source: Public Records
Mortgage History
| Date | Status | Borrower | Loan Amount |
|---|---|---|---|
| Open | Ortiz David | $95,000 |
Source: Public Records
Tax History Compared to Growth
Tax History
| Year | Tax Paid | Tax Assessment Tax Assessment Total Assessment is a certain percentage of the fair market value that is determined by local assessors to be the total taxable value of land and additions on the property. | Land | Improvement |
|---|---|---|---|---|
| 2024 | $6,381 | $243,000 | $48,600 | $194,400 |
| 2023 | $4,319 | $105,000 | $27,200 | $77,800 |
| 2022 | $4,227 | $105,000 | $27,200 | $77,800 |
| 2021 | $4,218 | $105,000 | $27,200 | $77,800 |
| 2020 | $3,992 | $105,000 | $27,200 | $77,800 |
| 2019 | $4,134 | $105,000 | $27,200 | $77,800 |
| 2018 | $3,993 | $105,000 | $27,200 | $77,800 |
| 2017 | $2,263 | $105,000 | $27,200 | $77,800 |
| 2016 | $5,059 | $125,000 | $27,200 | $97,800 |
| 2015 | $5,318 | $144,900 | $29,000 | $115,900 |
| 2014 | -- | $144,900 | $29,000 | $115,900 |
Source: Public Records
Map
Nearby Homes
- 195 Kent St
- 34 Buchanan St
- 282 Manning Blvd
- 15 Buchanan St
- 278 Manning Blvd
- 349 Manning Blvd
- 357 Manning Blvd
- 866 Washington Ave
- 118 N Allen St
- 129 N Pine Ave
- 112 N Allen St
- 81 N Main Ave
- 9 Rawson St
- 184 Benson St
- 160 Manning Blvd
- 40 Garfield Place
- 42 Garfield Place
- 847 Jay St
- 38 Garfield Place
- 808 Lancaster St