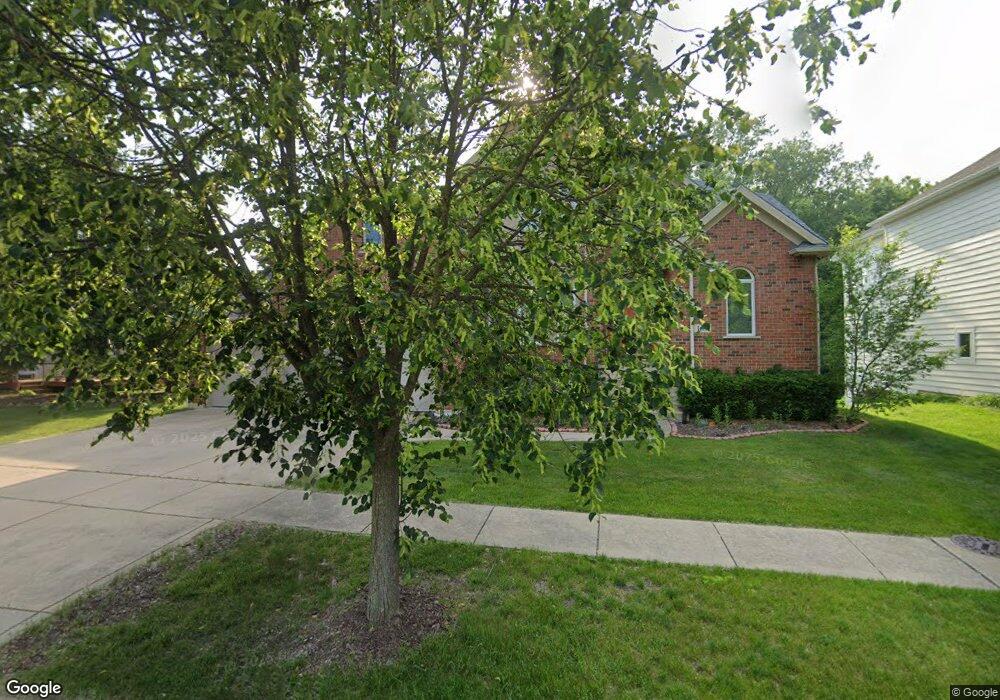
169 N Clyde Ave Palatine, IL 60067
Estimated Value: $710,000 - $964,000
4
Beds
5
Baths
3,953
Sq Ft
$218/Sq Ft
Est. Value
About This Home
This home is located at 169 N Clyde Ave, Palatine, IL 60067 and is currently estimated at $862,665, approximately $218 per square foot. 169 N Clyde Ave is a home located in Cook County with nearby schools including Thomas Jefferson Elementary School, Marion Jordan Elementary School, and Walter R. Sundling Junior High School.
Ownership History
Date
Name
Owned For
Owner Type
Purchase Details
Closed on
Aug 25, 2020
Sold by
Reddy Srinivas and Reddy Sailaja V
Bought by
Reddy Srinivas K and Srinivas K Reddy Living Trust
Current Estimated Value
Purchase Details
Closed on
Aug 7, 2003
Sold by
Houde Stephen J and House Anita K
Bought by
Maramrddy Reddy and Maramrddy Sailaja V
Home Financials for this Owner
Home Financials are based on the most recent Mortgage that was taken out on this home.
Original Mortgage
$555,000
Outstanding Balance
$250,614
Interest Rate
5.97%
Mortgage Type
Unknown
Estimated Equity
$612,051
Purchase Details
Closed on
Apr 2, 2002
Sold by
Nichols Grove Properties Llc
Bought by
We & 4 Custom Homes Llc
Home Financials for this Owner
Home Financials are based on the most recent Mortgage that was taken out on this home.
Original Mortgage
$540,000
Interest Rate
4.75%
Create a Home Valuation Report for This Property
The Home Valuation Report is an in-depth analysis detailing your home's value as well as a comparison with similar homes in the area
Home Values in the Area
Average Home Value in this Area
Purchase History
| Date | Buyer | Sale Price | Title Company |
|---|---|---|---|
| Reddy Srinivas K | -- | None Available | |
| Maramrddy Reddy | $695,000 | Ticor Title Insurance | |
| We & 4 Custom Homes Llc | $205,000 | -- |
Source: Public Records
Mortgage History
| Date | Status | Borrower | Loan Amount |
|---|---|---|---|
| Open | Maramrddy Reddy | $555,000 | |
| Previous Owner | We & 4 Custom Homes Llc | $540,000 |
Source: Public Records
Tax History Compared to Growth
Tax History
| Year | Tax Paid | Tax Assessment Tax Assessment Total Assessment is a certain percentage of the fair market value that is determined by local assessors to be the total taxable value of land and additions on the property. | Land | Improvement |
|---|---|---|---|---|
| 2024 | $18,366 | $65,353 | $8,208 | $57,145 |
| 2023 | $18,782 | $65,353 | $8,208 | $57,145 |
| 2022 | $18,782 | $69,000 | $8,208 | $60,792 |
| 2021 | $16,478 | $54,067 | $4,788 | $49,279 |
| 2020 | $16,305 | $54,067 | $4,788 | $49,279 |
| 2019 | $16,284 | $60,209 | $4,788 | $55,421 |
| 2018 | $19,540 | $66,311 | $4,446 | $61,865 |
| 2017 | $19,189 | $66,311 | $4,446 | $61,865 |
| 2016 | $18,094 | $66,311 | $4,446 | $61,865 |
| 2015 | $16,378 | $55,927 | $4,104 | $51,823 |
| 2014 | $16,195 | $55,927 | $4,104 | $51,823 |
| 2013 | $16,728 | $59,190 | $4,104 | $55,086 |
Source: Public Records
Map
Nearby Homes
- 1120 W Wilson St
- 260 N Clyde Ave
- 951 W Willow St
- 155 Burleigh Ln Unit 66
- 105 Craigie Ln Unit 22
- 185 Barra Ln Unit 158
- 886 W Palatine Rd
- 43 Ravenscraig Ln Unit 34
- 77 N Quentin Rd Unit 414
- 77 N Quentin Rd Unit 202
- 192 Glamis Ln Unit 131
- 445 N Cambridge Dr
- 558 Saint Andrews Ln
- 550 N Quentin Rd
- 580 N Quentin Rd
- 566 W Bridge View Ct
- 836 W Dorchester Rd
- 1124 W Colfax St
- 834 W Dorchester Rd
- 667 N Morrison Ave
- 157 N Clyde Ave
- 1055 W Wood St
- 1061 W Wood St
- 145 N Clyde Ave
- 1051 W Wood St
- 1113 W Wood St
- 1025 W Wood St
- 1025 W Wood St
- 144 N Clyde Ave
- 1070 W Wood St
- 1060 W Wood St
- 1017 W Wood St
- 1052 W Wood St
- 1125 W Wood St
- 178 N Middleton Ave
- 1009 W Wood St
- 1108 W Wilson St
- 1030 W Wood St
- 150 N Middleton Ave
- 130 N Middleton Ave