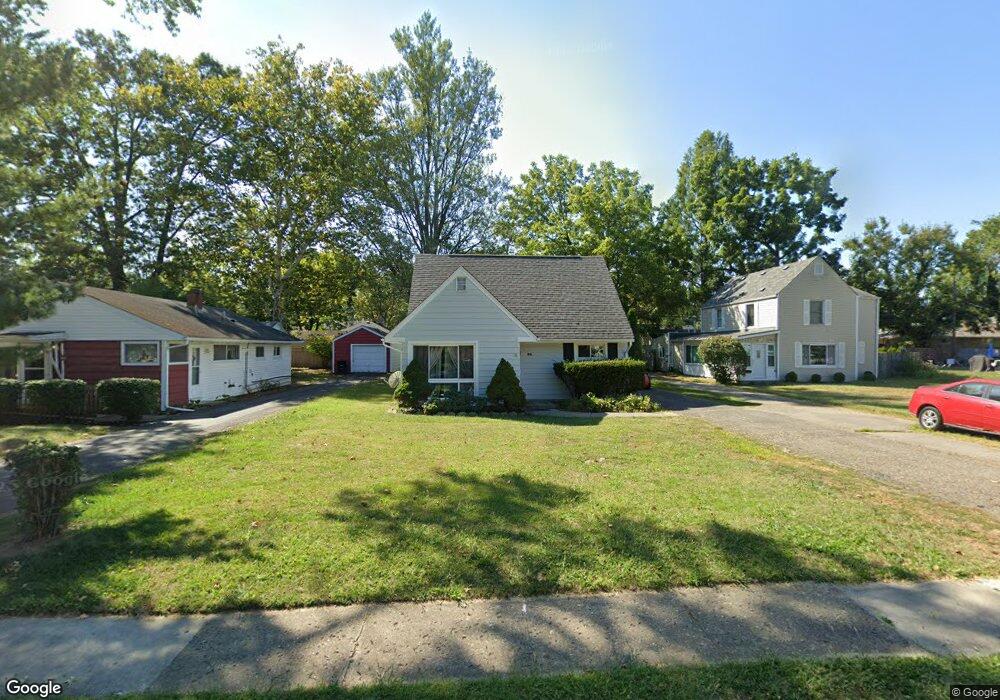
169 N Gould Rd Columbus, OH 43209
Estimated Value: $347,000 - $387,852
3
Beds
2
Baths
1,598
Sq Ft
$226/Sq Ft
Est. Value
About This Home
This home is located at 169 N Gould Rd, Columbus, OH 43209 and is currently estimated at $360,713, approximately $225 per square foot. 169 N Gould Rd is a home located in Franklin County with nearby schools including Maryland Elementary School, Bexley Middle School, and Bexley High School.
Ownership History
Date
Name
Owned For
Owner Type
Purchase Details
Closed on
Mar 21, 2025
Sold by
Dashkovsky Alexander and Dashkovsky Ksenia
Bought by
Agrawal Girdhar and Khetawat Astha
Current Estimated Value
Home Financials for this Owner
Home Financials are based on the most recent Mortgage that was taken out on this home.
Original Mortgage
$241,500
Outstanding Balance
$240,264
Interest Rate
6.87%
Mortgage Type
New Conventional
Estimated Equity
$120,449
Purchase Details
Closed on
Nov 14, 2006
Sold by
Harr Steven I and Harr Michelle
Bought by
Dashkovsky Edward and Dashkovsky Alexander
Purchase Details
Closed on
Apr 17, 2003
Sold by
Harr Michelle
Bought by
Harr Steven I
Purchase Details
Closed on
Mar 12, 2003
Sold by
Estate Of Serene P Harr
Bought by
Walsh Jennifer and Harr Michelle
Create a Home Valuation Report for This Property
The Home Valuation Report is an in-depth analysis detailing your home's value as well as a comparison with similar homes in the area
Home Values in the Area
Average Home Value in this Area
Purchase History
| Date | Buyer | Sale Price | Title Company |
|---|---|---|---|
| Agrawal Girdhar | $345,000 | Rapid Title | |
| Dashkovsky Edward | $113,000 | Talon Group | |
| Harr Steven I | -- | -- | |
| Walsh Jennifer | -- | -- | |
| Harr Serene P | -- | -- |
Source: Public Records
Mortgage History
| Date | Status | Borrower | Loan Amount |
|---|---|---|---|
| Open | Agrawal Girdhar | $241,500 |
Source: Public Records
Tax History Compared to Growth
Tax History
| Year | Tax Paid | Tax Assessment Tax Assessment Total Assessment is a certain percentage of the fair market value that is determined by local assessors to be the total taxable value of land and additions on the property. | Land | Improvement |
|---|---|---|---|---|
| 2024 | $5,820 | $104,800 | $50,930 | $53,870 |
| 2023 | $5,233 | $104,790 | $50,925 | $53,865 |
| 2022 | $4,957 | $79,740 | $42,530 | $37,210 |
| 2021 | $4,961 | $79,740 | $42,530 | $37,210 |
| 2020 | $4,917 | $79,740 | $42,530 | $37,210 |
| 2019 | $4,566 | $65,140 | $35,460 | $29,680 |
| 2018 | $3,352 | $65,140 | $35,460 | $29,680 |
| 2017 | $3,872 | $65,140 | $35,460 | $29,680 |
| 2016 | $2,728 | $41,940 | $13,970 | $27,970 |
| 2015 | $2,736 | $41,940 | $13,970 | $27,970 |
| 2014 | $2,752 | $41,940 | $13,970 | $27,970 |
| 2013 | $1,430 | $41,930 | $13,965 | $27,965 |
Source: Public Records
Map
Nearby Homes
- 205 N Gould Rd
- 124 N Gould Rd
- 2867 Ruhl Ave Unit 869
- 50 N Broadleigh Rd
- 47 N Chesterfield Rd
- 263 Edgevale Rd
- 2779 Columbus Ave
- 238 Edgevale Rd
- 50 S Chesterfield Rd
- 96 N Cassingham Rd
- 2738 E Broad St
- 3235 Maryland Ave
- 2731 E Broad St
- 2717 E Broad St
- 49 N Cassingham Rd
- 123 S Gould Rd
- 2695 Bellwood Ave
- 142 S Gould Rd
- 243 N James Rd
- 253 N James Rd
- 161 N Gould Rd
- 183 N Gould Rd
- 183 N Gould Rd Unit 183 Gould
- 155 N Gould Rd
- 185 N Gould Rd
- 176 N Merkle Rd
- 168 N Merkle Rd
- 168 N Merkle Rd
- 184 N Merkle Rd
- 184 N Merkle Rd
- 149 N Gould Rd
- 160 N Merkle Rd
- 160 N Merkle Rd
- 192 N Merkle Rd
- 170 N Gould Rd
- 164 N Gould Rd
- 176 N Gould Rd
- 141 N Gould Rd
- 154 N Merkle Rd
- 141 N Gould Rd