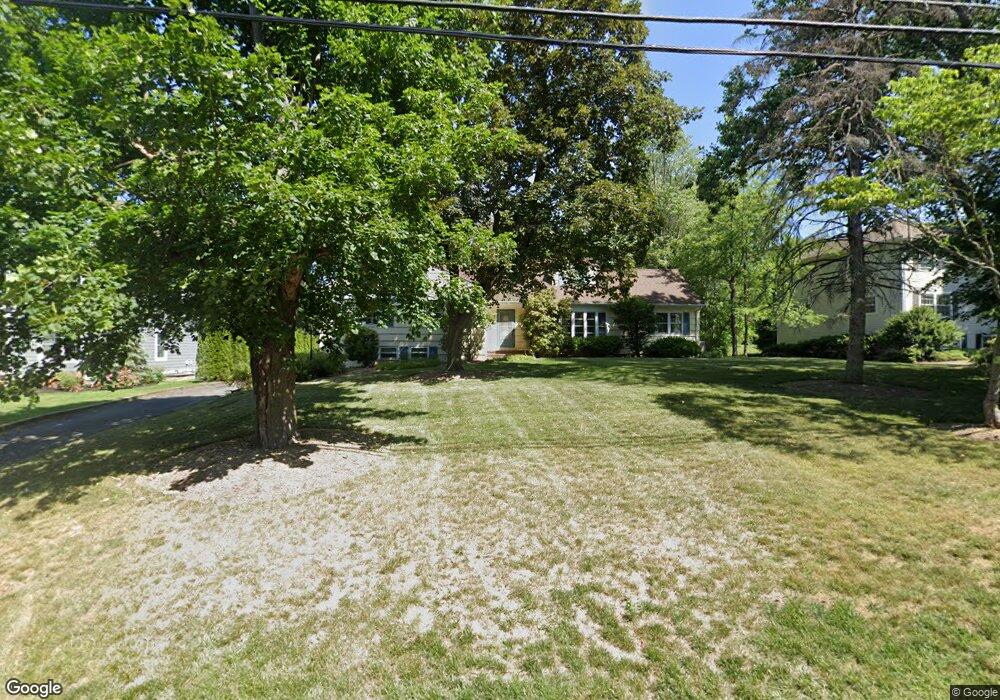
169 Noe Ave Chatham, NJ 07928
Estimated Value: $1,726,532 - $2,611,000
--
Bed
--
Bath
3,577
Sq Ft
$598/Sq Ft
Est. Value
About This Home
This home is located at 169 Noe Ave, Chatham, NJ 07928 and is currently estimated at $2,137,844, approximately $597 per square foot. 169 Noe Ave is a home located in Morris County with nearby schools including Chatham High School, St. Patrick School, and Chatham Day School.
Ownership History
Date
Name
Owned For
Owner Type
Purchase Details
Closed on
Jul 22, 1996
Sold by
Mcnally Peter J and Mcnally Ellen M
Bought by
Sinha Deepen and Sinha Neelu
Current Estimated Value
Home Financials for this Owner
Home Financials are based on the most recent Mortgage that was taken out on this home.
Original Mortgage
$328,000
Outstanding Balance
$22,685
Interest Rate
7.75%
Estimated Equity
$2,115,159
Create a Home Valuation Report for This Property
The Home Valuation Report is an in-depth analysis detailing your home's value as well as a comparison with similar homes in the area
Home Values in the Area
Average Home Value in this Area
Purchase History
| Date | Buyer | Sale Price | Title Company |
|---|---|---|---|
| Sinha Deepen | $410,000 | Chicago Title Insurance Co |
Source: Public Records
Mortgage History
| Date | Status | Borrower | Loan Amount |
|---|---|---|---|
| Open | Sinha Deepen | $328,000 |
Source: Public Records
Tax History Compared to Growth
Tax History
| Year | Tax Paid | Tax Assessment Tax Assessment Total Assessment is a certain percentage of the fair market value that is determined by local assessors to be the total taxable value of land and additions on the property. | Land | Improvement |
|---|---|---|---|---|
| 2025 | $17,014 | $855,400 | $626,700 | $228,700 |
| 2024 | $16,732 | $855,400 | $626,700 | $228,700 |
| 2023 | $16,732 | $855,400 | $626,700 | $228,700 |
| 2022 | $16,518 | $855,400 | $626,700 | $228,700 |
| 2021 | $16,518 | $855,400 | $626,700 | $228,700 |
| 2020 | $16,193 | $855,400 | $626,700 | $228,700 |
| 2019 | $15,859 | $855,400 | $626,700 | $228,700 |
| 2018 | $15,679 | $855,400 | $626,700 | $228,700 |
| 2017 | $15,286 | $855,400 | $626,700 | $228,700 |
| 2016 | $15,046 | $855,400 | $626,700 | $228,700 |
| 2015 | $14,987 | $855,400 | $626,700 | $228,700 |
| 2014 | $14,867 | $855,400 | $626,700 | $228,700 |
Source: Public Records
Map
Nearby Homes
- 16 Driftway St
- 21 Spring St
- 115 Woodland Rd
- 91 Woodland Rd
- 21 Rolling Hill Ct
- 70 Hampton Rd
- 3 Woodland Rd
- 2 Whitman Dr
- 85 Southern Blvd
- 206 Longwood Ave
- 85 Kings Rd
- 11 Dellwood Ave
- 21 Belmont Ave
- 21 Belmont Ave Unit B
- 21 Belmont Ave Unit a
- 17 Hilltop Terrace
- 318 Main St Unit 34
- 380 Main St Unit19
- 685 Shunpike Rd
- 5 Woodland Rd