169 Old Oak Valley Rd Toccoa, GA 30577
Estimated Value: $208,000 - $323,000
2
Beds
2
Baths
1,612
Sq Ft
$153/Sq Ft
Est. Value
About This Home
This home is located at 169 Old Oak Valley Rd, Toccoa, GA 30577 and is currently estimated at $247,116, approximately $153 per square foot. 169 Old Oak Valley Rd is a home located in Stephens County with nearby schools including Stephens County High School.
Ownership History
Date
Name
Owned For
Owner Type
Purchase Details
Closed on
Jun 26, 2006
Sold by
Bush Randy
Bought by
Gould Joseph
Current Estimated Value
Home Financials for this Owner
Home Financials are based on the most recent Mortgage that was taken out on this home.
Original Mortgage
$77,900
Outstanding Balance
$45,256
Interest Rate
6.55%
Mortgage Type
New Conventional
Estimated Equity
$201,860
Purchase Details
Closed on
May 19, 2005
Sold by
Keyser Gladys M
Bought by
Bush Randy
Purchase Details
Closed on
Sep 8, 1999
Bought by
<Buyer Info Not Present>
Purchase Details
Closed on
May 1, 1999
Bought by
<Buyer Info Not Present>
Purchase Details
Closed on
Jul 1, 1992
Bought by
<Buyer Info Not Present>
Purchase Details
Closed on
Aug 1, 1985
Bought by
<Buyer Info Not Present>
Create a Home Valuation Report for This Property
The Home Valuation Report is an in-depth analysis detailing your home's value as well as a comparison with similar homes in the area
Home Values in the Area
Average Home Value in this Area
Purchase History
| Date | Buyer | Sale Price | Title Company |
|---|---|---|---|
| Gould Joseph | $82,000 | -- | |
| Bush Randy | $77,000 | -- | |
| <Buyer Info Not Present> | -- | -- | |
| <Buyer Info Not Present> | -- | -- | |
| <Buyer Info Not Present> | $39,000 | -- | |
| <Buyer Info Not Present> | $39,900 | -- |
Source: Public Records
Mortgage History
| Date | Status | Borrower | Loan Amount |
|---|---|---|---|
| Open | Gould Joseph | $77,900 |
Source: Public Records
Tax History Compared to Growth
Tax History
| Year | Tax Paid | Tax Assessment Tax Assessment Total Assessment is a certain percentage of the fair market value that is determined by local assessors to be the total taxable value of land and additions on the property. | Land | Improvement |
|---|---|---|---|---|
| 2025 | $1,404 | $65,032 | $2,452 | $62,580 |
| 2024 | $1,207 | $41,634 | $2,452 | $39,182 |
| 2023 | $1,085 | $38,456 | $2,452 | $36,004 |
| 2022 | $1,015 | $36,081 | $2,452 | $33,629 |
| 2021 | $973 | $33,111 | $2,452 | $30,659 |
| 2020 | $956 | $32,270 | $2,452 | $29,818 |
| 2019 | $956 | $32,153 | $2,335 | $29,818 |
| 2018 | $956 | $32,153 | $2,335 | $29,818 |
| 2017 | $971 | $32,153 | $2,335 | $29,818 |
| 2016 | $956 | $32,152 | $2,334 | $29,817 |
| 2015 | $1,001 | $32,150 | $2,334 | $29,815 |
| 2014 | $1,011 | $31,935 | $2,335 | $29,600 |
| 2013 | -- | $32,518 | $2,918 | $29,600 |
Source: Public Records
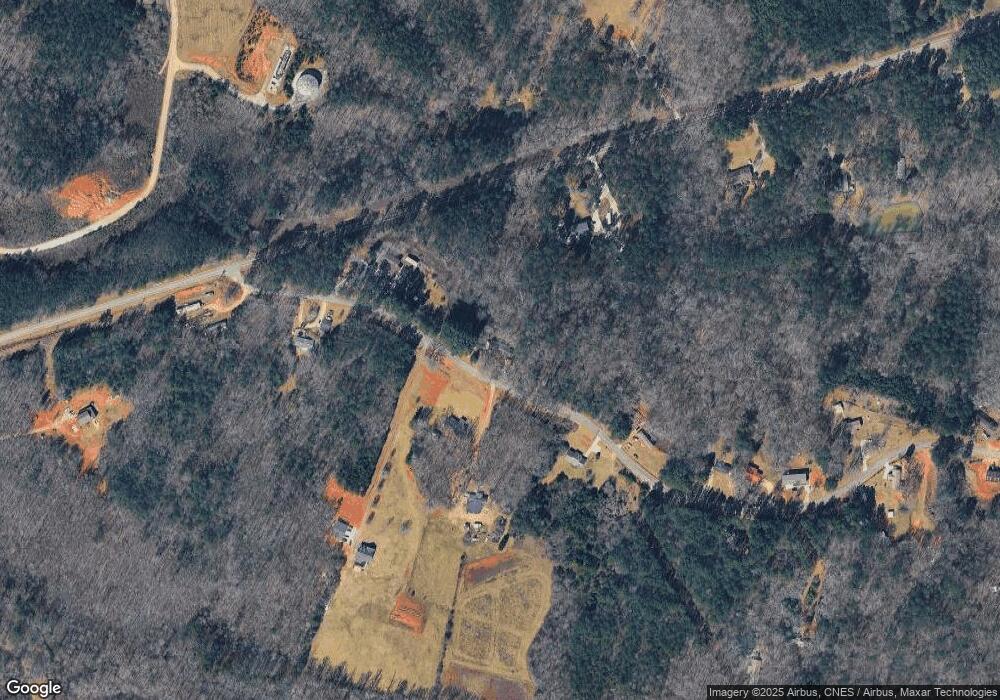
Map
Nearby Homes
- 78 Wards Pond Way
- 68 Wards Pond Way
- 109 Coneflower Ln
- 300 Rock Creek Trail
- 101 Cottage Ln
- 15 Cottage Ln
- 15 Cottage Ln Unit 102
- 29 Cottage Ln
- 17 Cottage Ln Unit 202
- 60 Timber Ridge Trail Unit C1-20
- 195 Switchback Run
- 256 Golf Ridge Way
- 42 Lookout Point
- 410 Edgewater Trail S
- 334 Edgewater Trail N
- 334 Edgewater Trail S
- 194 Edgewater Trail S
- 173 Edgewater Trail S
- 580 N Edgewater Trail
- 1308 Currahee Club Dr
- 2179 Old Oak Valley Rd
- 176 Old Oak Valley Rd
- 97 Old Oak Valley Rd
- 271 Old Oak Valley Rd
- 182 Old Oak Valley Rd
- 52 Old Oak Valley Rd
- 130 Old Oak Valley Rd
- 270 Old Oak Valley Rd
- 0 Oak Valley Dr Unit 8356683
- 5436 Oak Valley Rd
- 5486 Oak Valley Rd
- 5486 Oak Valley Rd
- 454 Old Oak Valley Rd
- 5429 Oak Valley Rd Unit 22AC
- 5429 Oak Valley Rd
- 328 Old Oak Valley Rd
- 482 Old Oak Valley Rd
- 386 Old Oak Valley Rd
- 4930 Oak Valley Rd
- 520 Old Oak Valley Rd