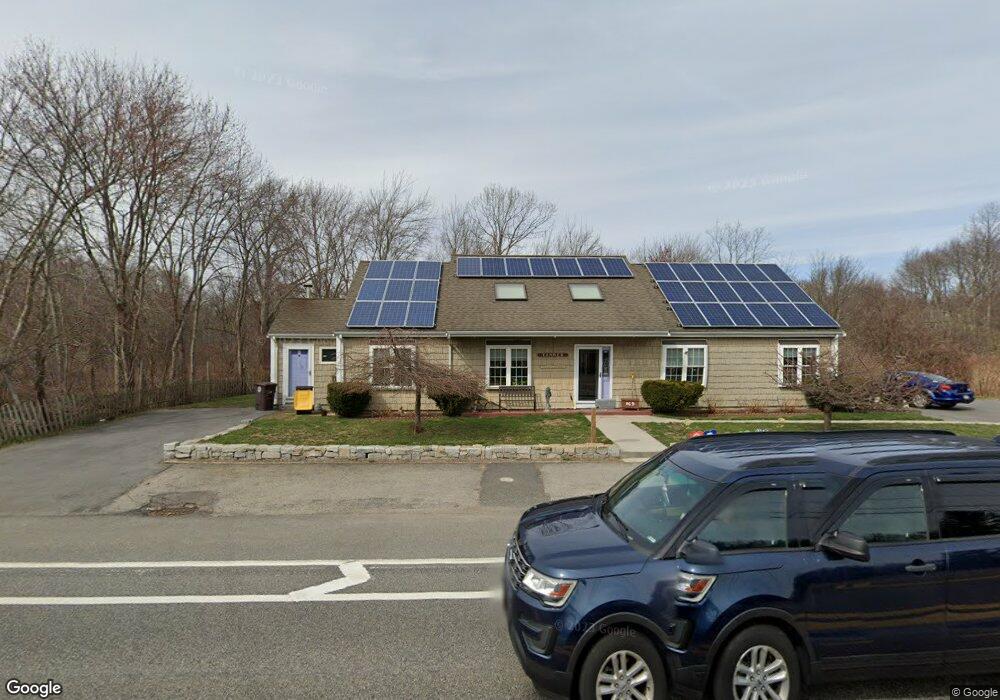
169 Park Ave W South Weymouth, MA 02190
South Weymouth NeighborhoodEstimated Value: $699,000 - $931,000
2
Beds
2
Baths
2,072
Sq Ft
$388/Sq Ft
Est. Value
About This Home
This home is located at 169 Park Ave W, South Weymouth, MA 02190 and is currently estimated at $804,573, approximately $388 per square foot. 169 Park Ave W is a home located in Norfolk County with nearby schools including Thomas V Nash, Abigail Adams Middle School, and Weymouth Middle School Chapman.
Ownership History
Date
Name
Owned For
Owner Type
Purchase Details
Closed on
Oct 11, 2001
Sold by
South Shore Hospital
Bought by
Tanner Thomas E and Tanner Josephine
Current Estimated Value
Home Financials for this Owner
Home Financials are based on the most recent Mortgage that was taken out on this home.
Original Mortgage
$220,000
Interest Rate
6.93%
Mortgage Type
Purchase Money Mortgage
Purchase Details
Closed on
May 16, 1989
Sold by
Forster Carmella M
Bought by
Tanner Thomas E
Home Financials for this Owner
Home Financials are based on the most recent Mortgage that was taken out on this home.
Original Mortgage
$318,000
Interest Rate
11.14%
Mortgage Type
Purchase Money Mortgage
Create a Home Valuation Report for This Property
The Home Valuation Report is an in-depth analysis detailing your home's value as well as a comparison with similar homes in the area
Home Values in the Area
Average Home Value in this Area
Purchase History
| Date | Buyer | Sale Price | Title Company |
|---|---|---|---|
| Tanner Thomas E | $60,000 | -- | |
| Tanner Thomas E | $143,000 | -- |
Source: Public Records
Mortgage History
| Date | Status | Borrower | Loan Amount |
|---|---|---|---|
| Open | Tanner Thomas E | $332,000 | |
| Closed | Tanner Thomas E | $345,000 | |
| Closed | Tanner Thomas E | $220,000 | |
| Previous Owner | Tanner Thomas E | $318,000 |
Source: Public Records
Tax History Compared to Growth
Tax History
| Year | Tax Paid | Tax Assessment Tax Assessment Total Assessment is a certain percentage of the fair market value that is determined by local assessors to be the total taxable value of land and additions on the property. | Land | Improvement |
|---|---|---|---|---|
| 2025 | $6,489 | $642,500 | $192,500 | $450,000 |
| 2024 | $6,205 | $604,200 | $183,400 | $420,800 |
| 2023 | $6,098 | $583,500 | $169,800 | $413,700 |
| 2022 | $5,949 | $519,100 | $157,200 | $361,900 |
| 2021 | $5,409 | $460,700 | $157,200 | $303,500 |
| 2020 | $5,223 | $438,200 | $157,200 | $281,000 |
| 2019 | $5,134 | $423,600 | $151,200 | $272,400 |
| 2018 | $4,998 | $399,800 | $144,000 | $255,800 |
| 2017 | $4,916 | $383,800 | $137,100 | $246,700 |
| 2016 | $4,762 | $372,000 | $131,900 | $240,100 |
| 2015 | $4,386 | $340,000 | $118,700 | $221,300 |
| 2014 | $4,271 | $321,100 | $122,700 | $198,400 |
Source: Public Records
Map
Nearby Homes
- 24 Fisher Rd
- 16 Jay Rd
- 308 Forest St
- 27 Park Ave
- 2 Mitchell Ln Unit B
- 92 Mercury St
- 120 Randolph St
- 68 Massapoag St Unit 7
- 193 Randolph St
- 211 Randolph St
- 262 West St
- 255 West St
- 50 Hollis St
- 18 Fountain Ln Unit 2
- 45 Union St
- 261 Pleasant St Unit 3
- 261 Pleasant St Unit 5
- 354 Tilden Commons Ln
- 60 Greentree Ln Unit 38
- 55 Greentree Ln Unit 19
- 261 Columbian St Unit 8
- 257 Columbian St
- 147 Park Ave W
- 251 Columbian St
- 270 Columbian St
- 10 Millstone Ln
- 139 Park Ave W
- 133 Park Ave W
- 314 Columbian St
- 319 Columbian St
- 241 Columbian St
- 126 Park Ave W
- 125 Park Ave W
- 237 Columbian St
- 26 Millstone Ln
- 10 Columbian Woods
- 10 Columbian Woods Unit 10
- 0 Lot3a -Columbian Woods Unit 50387928
- 236 Columbian St
- 229 Columbian St