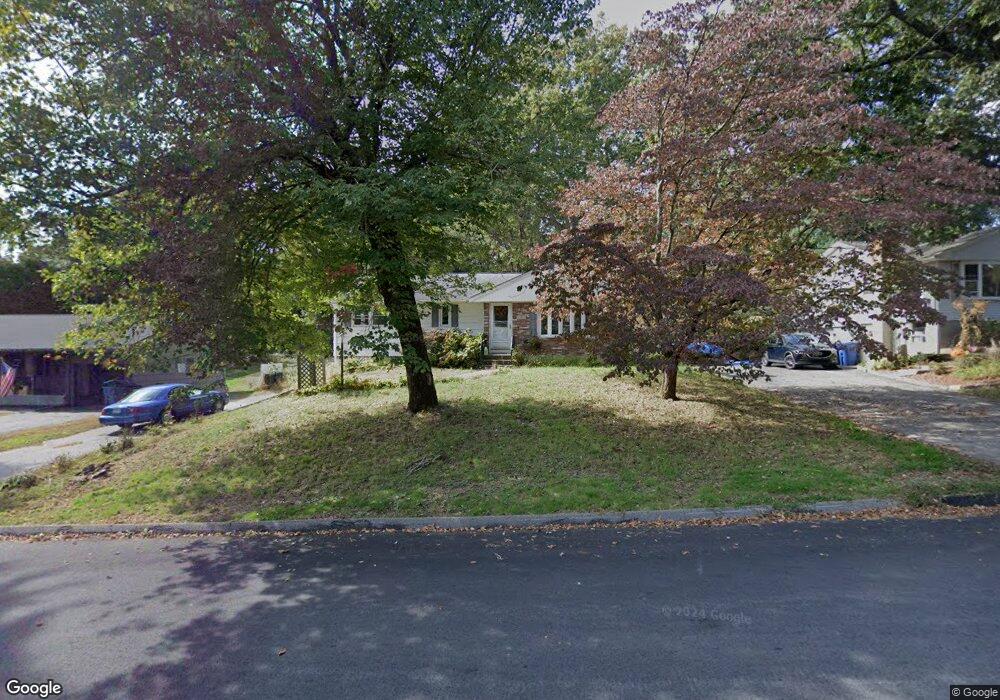
169 Park Avenue Extension Uncasville, CT 06382
Estimated Value: $319,000 - $406,000
3
Beds
2
Baths
1,046
Sq Ft
$333/Sq Ft
Est. Value
About This Home
This home is located at 169 Park Avenue Extension, Uncasville, CT 06382 and is currently estimated at $348,472, approximately $333 per square foot. 169 Park Avenue Extension is a home located in New London County with nearby schools including Leonard J. Tyl Middle School, Montville High School, and Mayflower Montessori School.
Ownership History
Date
Name
Owned For
Owner Type
Purchase Details
Closed on
Nov 16, 2021
Sold by
Giddings Elizabeth L
Bought by
Mcalpine Trent T and Page Crystal
Current Estimated Value
Home Financials for this Owner
Home Financials are based on the most recent Mortgage that was taken out on this home.
Original Mortgage
$206,565
Outstanding Balance
$189,281
Interest Rate
2.99%
Mortgage Type
Purchase Money Mortgage
Estimated Equity
$159,191
Purchase Details
Closed on
Aug 2, 2005
Sold by
Palladino-Carey Lynne
Bought by
Leuze Elizabeth
Home Financials for this Owner
Home Financials are based on the most recent Mortgage that was taken out on this home.
Original Mortgage
$200,000
Interest Rate
8.37%
Mortgage Type
Purchase Money Mortgage
Purchase Details
Closed on
Jan 13, 1989
Sold by
Sills Agnes
Bought by
Carey Lynne
Create a Home Valuation Report for This Property
The Home Valuation Report is an in-depth analysis detailing your home's value as well as a comparison with similar homes in the area
Home Values in the Area
Average Home Value in this Area
Purchase History
| Date | Buyer | Sale Price | Title Company |
|---|---|---|---|
| Mcalpine Trent T | $204,500 | None Available | |
| Mcalpine Trent T | $204,500 | None Available | |
| Leuze Elizabeth | $230,000 | -- | |
| Leuze Elizabeth | $230,000 | -- | |
| Carey Lynne | $131,500 | -- |
Source: Public Records
Mortgage History
| Date | Status | Borrower | Loan Amount |
|---|---|---|---|
| Open | Mcalpine Trent T | $206,565 | |
| Closed | Mcalpine Trent T | $206,565 | |
| Previous Owner | Carey Lynne | $191,070 | |
| Previous Owner | Carey Lynne | $200,000 |
Source: Public Records
Tax History Compared to Growth
Tax History
| Year | Tax Paid | Tax Assessment Tax Assessment Total Assessment is a certain percentage of the fair market value that is determined by local assessors to be the total taxable value of land and additions on the property. | Land | Improvement |
|---|---|---|---|---|
| 2025 | $3,698 | $128,100 | $31,220 | $96,880 |
| 2024 | $3,557 | $128,100 | $31,220 | $96,880 |
| 2023 | $3,557 | $128,100 | $31,220 | $96,880 |
| 2022 | $3,422 | $128,100 | $31,220 | $96,880 |
| 2021 | $3,254 | $102,500 | $30,910 | $71,590 |
| 2020 | $3,319 | $102,500 | $30,910 | $71,590 |
| 2019 | $3,332 | $102,500 | $30,910 | $71,590 |
| 2018 | $3,252 | $102,500 | $30,910 | $71,590 |
| 2017 | $3,249 | $102,500 | $30,910 | $71,590 |
| 2016 | $3,291 | $107,520 | $38,700 | $68,820 |
| 2015 | $3,291 | $107,520 | $38,700 | $68,820 |
| 2014 | $3,158 | $107,520 | $38,700 | $68,820 |
Source: Public Records
Map
Nearby Homes
- 150 Park Avenue Extension
- 26 Dydo Dr
- 16 Jacop Dr
- 114 Park Ave
- 145 Massapeag Side Rd
- 10 Riched Ln
- 2057 Norwich New London Turnpike
- 87 Fort Shantok Rd
- 9 Morgan St
- 61 Fort Shantok Rd
- 17B Massapeag Point Rd
- 60 Fort Shantok Rd
- 1465 Norwich-New London Turnpike
- 13 Skyline Dr
- 127 Massapeag Rd
- 140 Route 12
- 3 Holdsworth Rd
- 421 Kitemaug Rd
- 32 Cedar Ln
- 87 Gallivan Ln
- 163 Park Avenue Extension
- 173 Park Avenue Extension
- 177 Park Avenue Extension
- 7 Vartellas Dr
- 153 Park Avenue Extension
- 153 Park Avenue Extension
- 181 Park Avenue Extension
- 185 Park Ave
- 173 Park Avenue Extension
- 176 Park Avenue Extension
- 168 Park Avenue Extension
- 154 Park Avenue Extension
- 154 Park Avenue Extension
- 172 Park Avenue Extension
- 180 Park Avenue Extension
- 149 Park Avenue Extension
- 8 Vartellas Dr
- 11 Vartellas Dr
- 145 Park Avenue Extension
- 36 Baldwin Ct